January 20, 2019 / 5:59 PM
Zephyrus: Metrics Pipeline for a DIY Weather Station
projects
Observability is a critical component of running production software. It provides visibility into the health and performance of a complex system with many moving parts, exposing problems you didn't know you had. Proper instrumentation also provides a means of analyzing long-term trends in application performance across revisions, deploys, changes to the underlying infrastructure, and so on.
Is it possible to apply the same principles to the physical world? What would it take to track metrics produced by the surrounding environment as time-series data? More interestingly, what insight can such data provide?
Self-Hosted Weather Data
I had always wanted to create a DIY, self-hosted weather station. This was appealing to me for a variety of reasons:
- I can store historical, time-series data at any granularity I choose (providing a way for me to answer the question, for example, "what was the temperature at every minute between 9 AM and 10 AM two weeks ago?")
- The data is as accurate as possible (since it is collected at the source—my house—instead of the nearest weather station in the city)
- I can create my own weather API, which can be consumed (without limits and for free) by any other clients I write
- A full system would not be particularly resource-intensive: in terms of hardware, I would only need some physical sensors and a Linux box with appropriate I/O that can run a time-series database
I already have a server capable of storing time-series data. So I bought a couple sensors.
Introducing Zephyrus
Zephyrus is a robust, end-to-end system for deploying a self-hosted weather station. It provides an API abstraction layer for reading data from hardware sensors and a daemon for collecting that data as time-series statsd metrics. Together, these two components act as a metrics pipeline for arbitrary weather data.

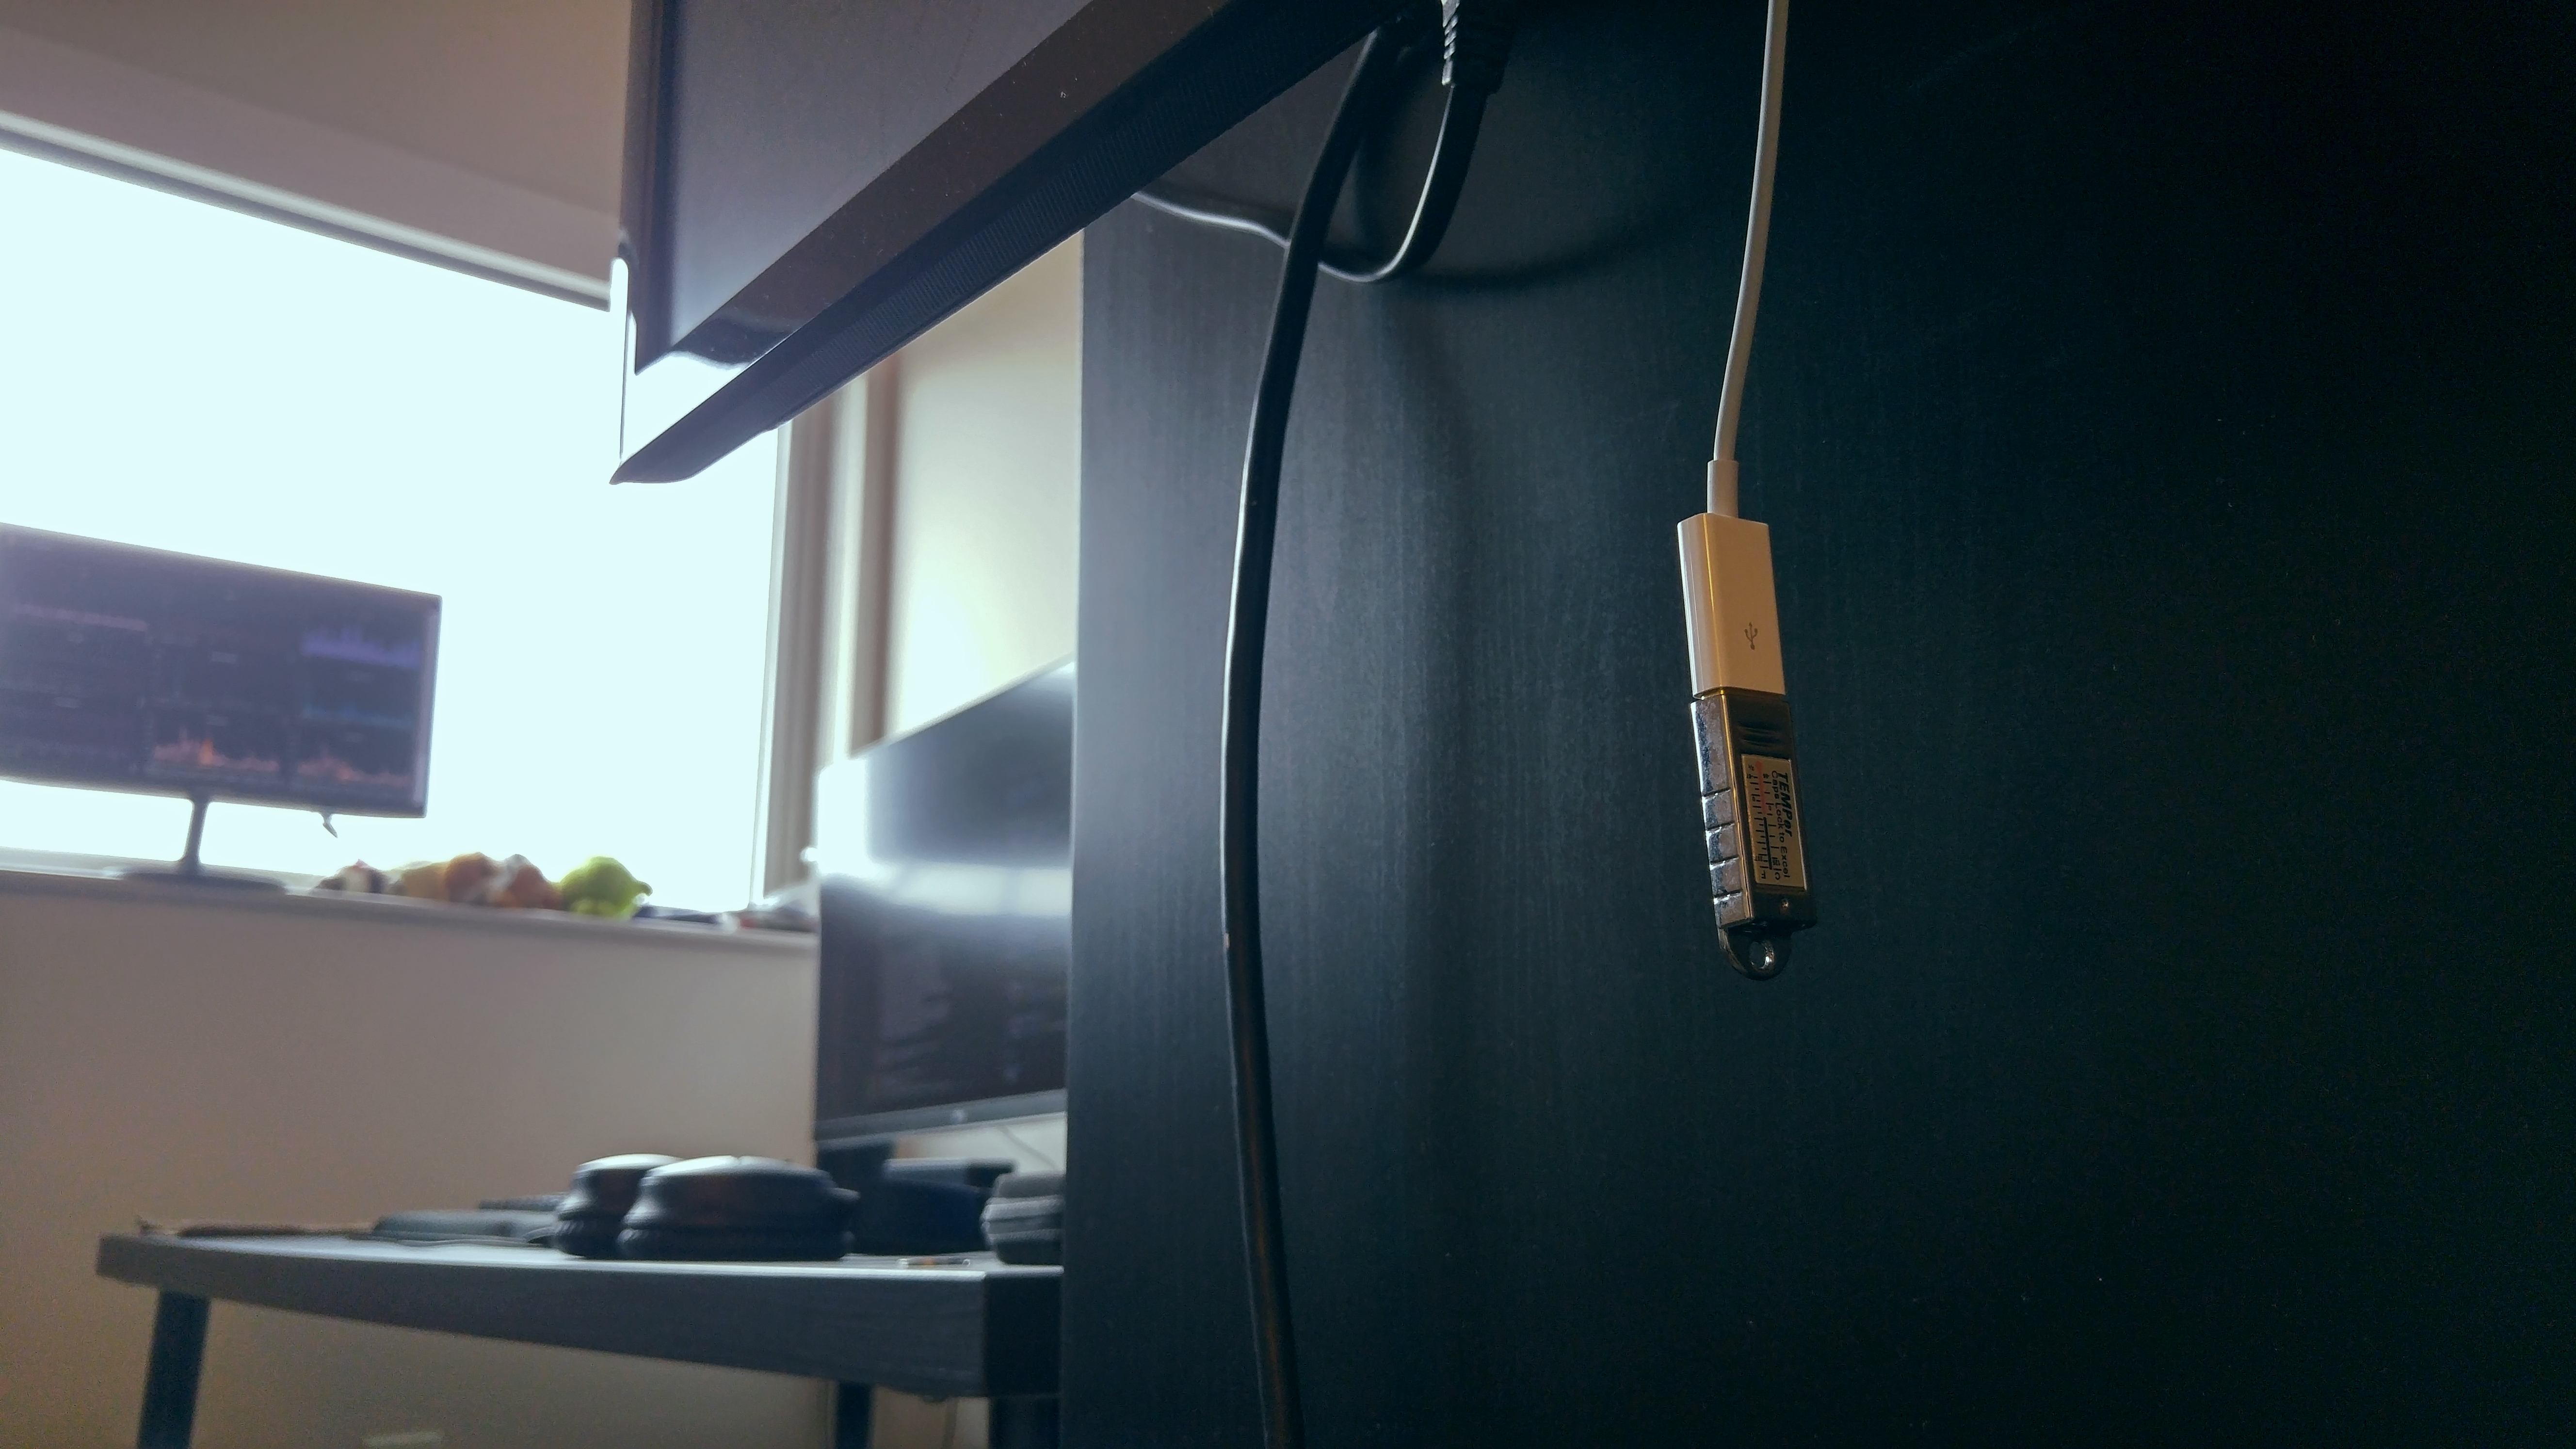
Zephyrus (as-is) only supports reporting temperature data; at the moment, I don't have a use case for any other weather metrics. It supports the Temper USB temperature sensoras the temperature-reporting hardware device. The universal interface (USB) and native support by the Linux kernel make it a desirable choice. I would otherwise need to have an intermediary microcontroller between the device and server if I opted for an analog sensor or a serial device.
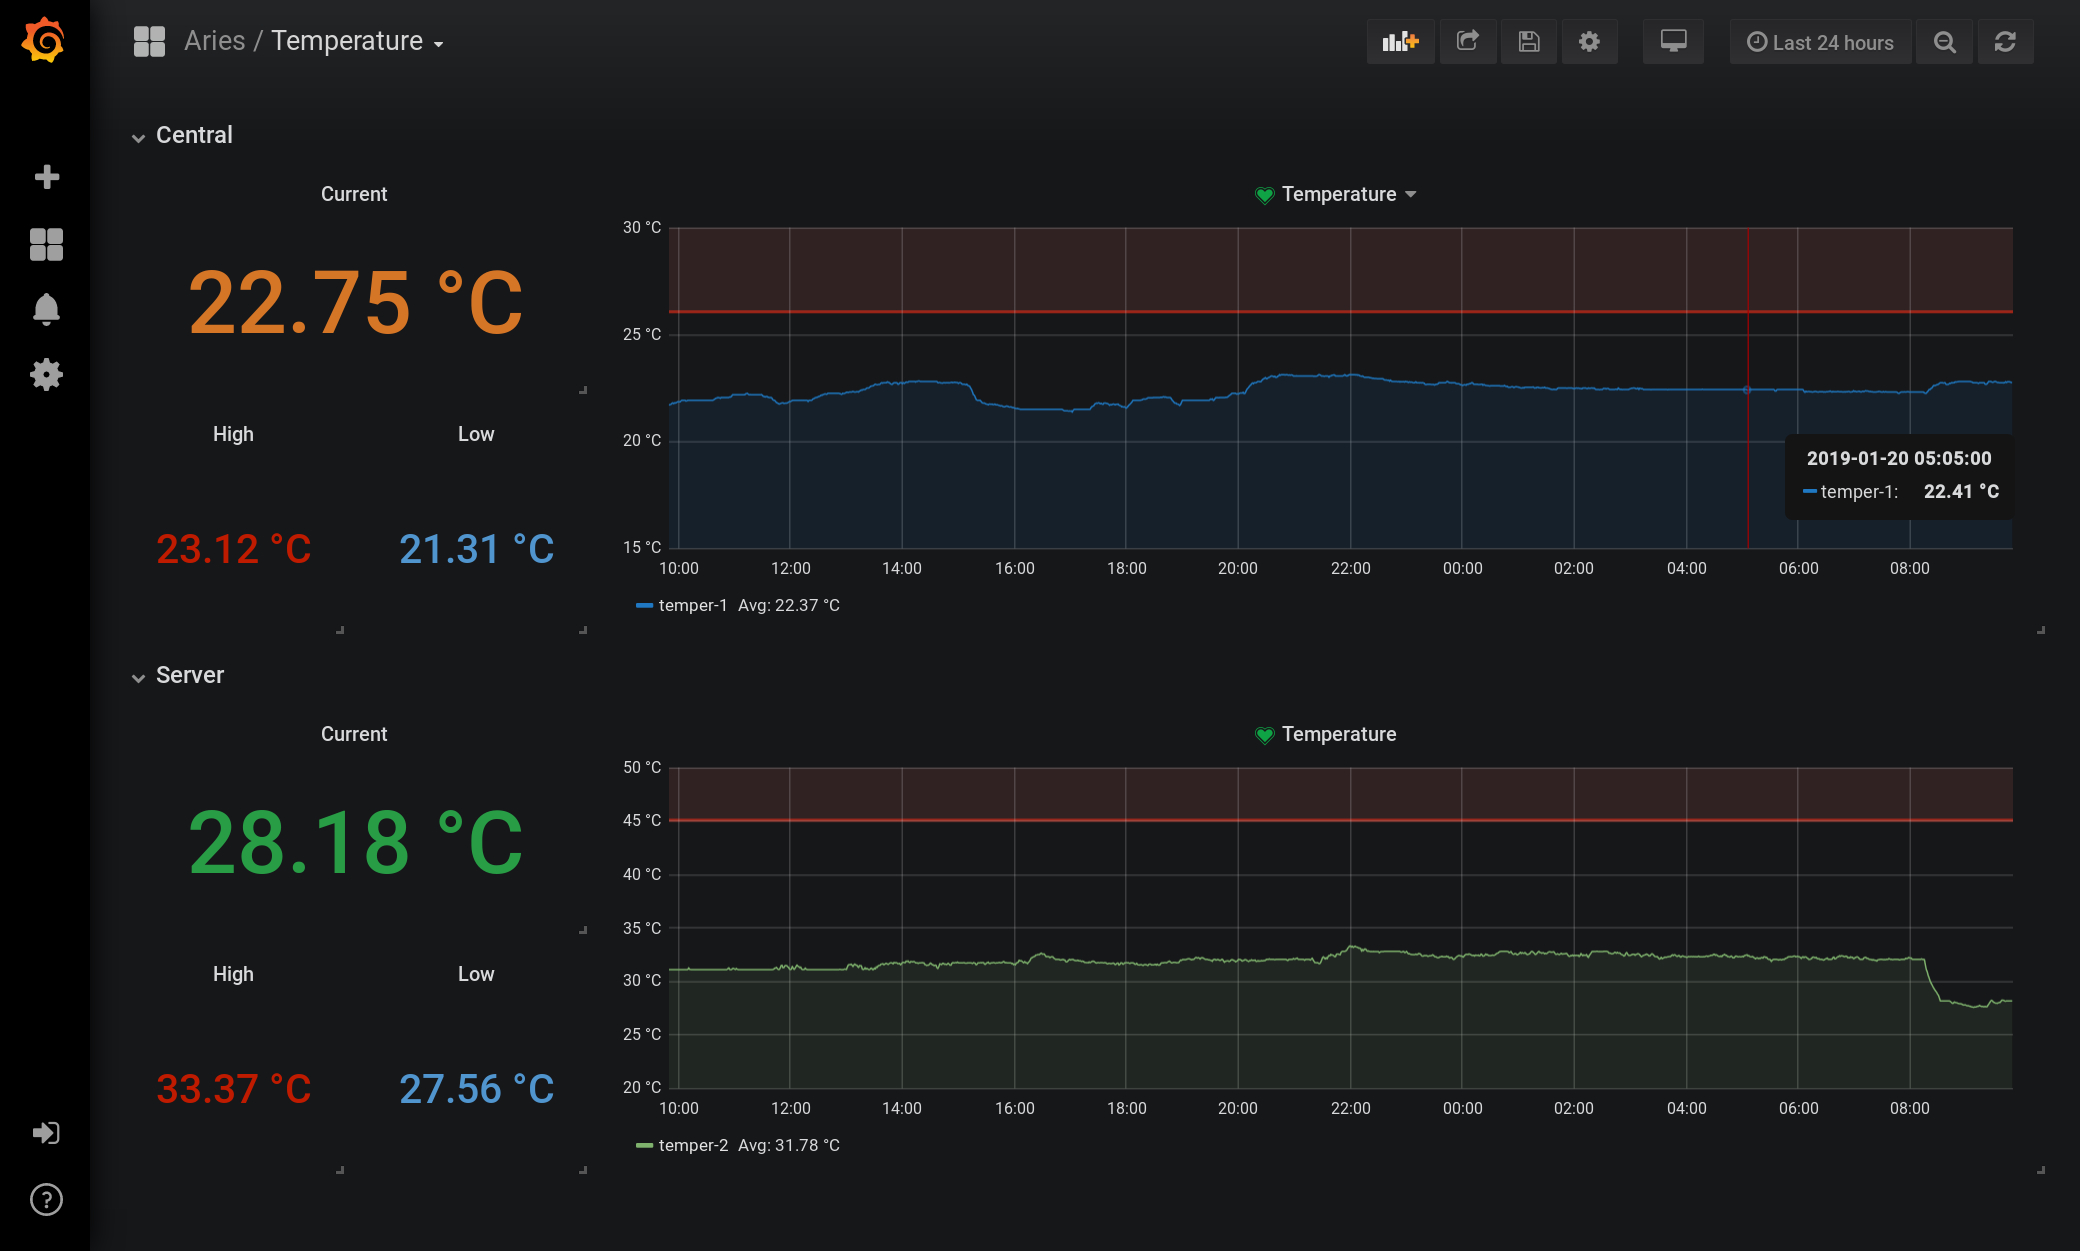
Zephyrus itself does not make any assumptions about how the emitted statsd metrics are consumed. In the typical case, they would be ingested into a time-series datastore (I use InfluxDB) and presented with a visualization layer (I use Grafana). This provides a really straightforward way of querying and visualizing historical data.
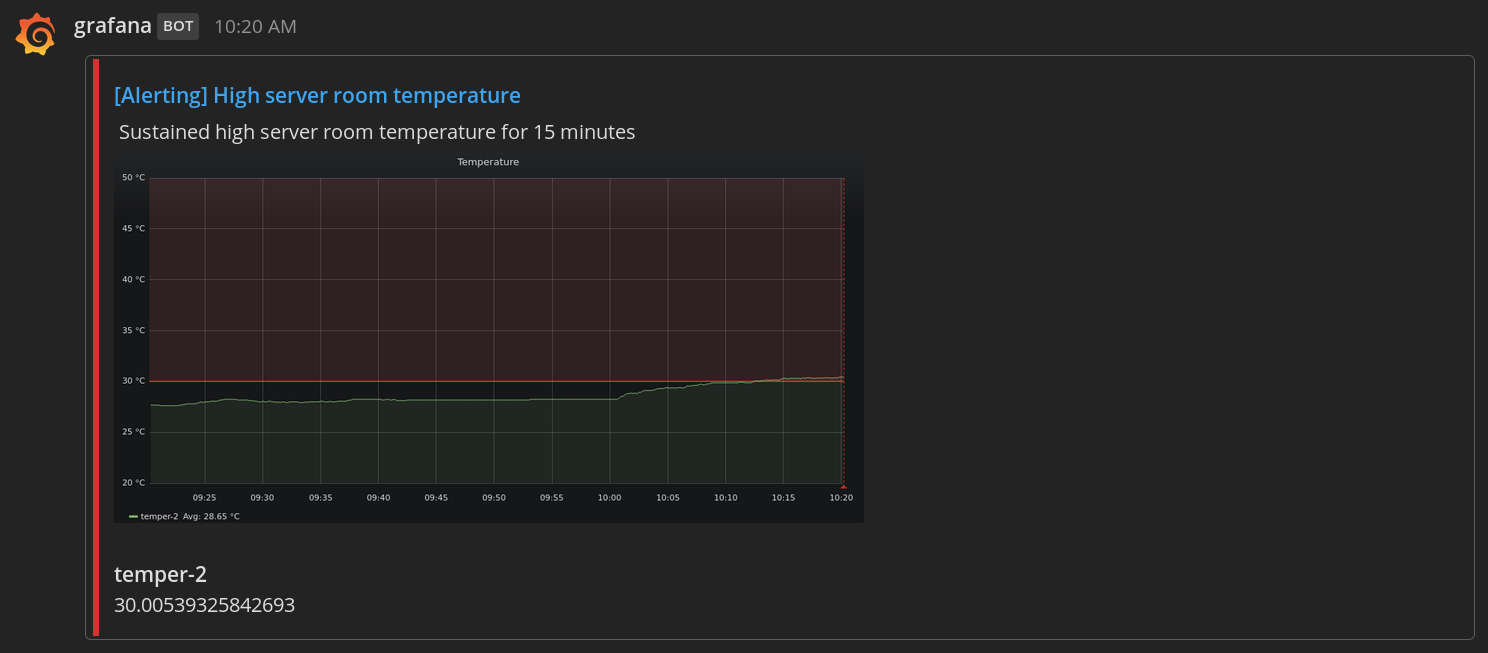
Grafana also has built-in support for alerting:
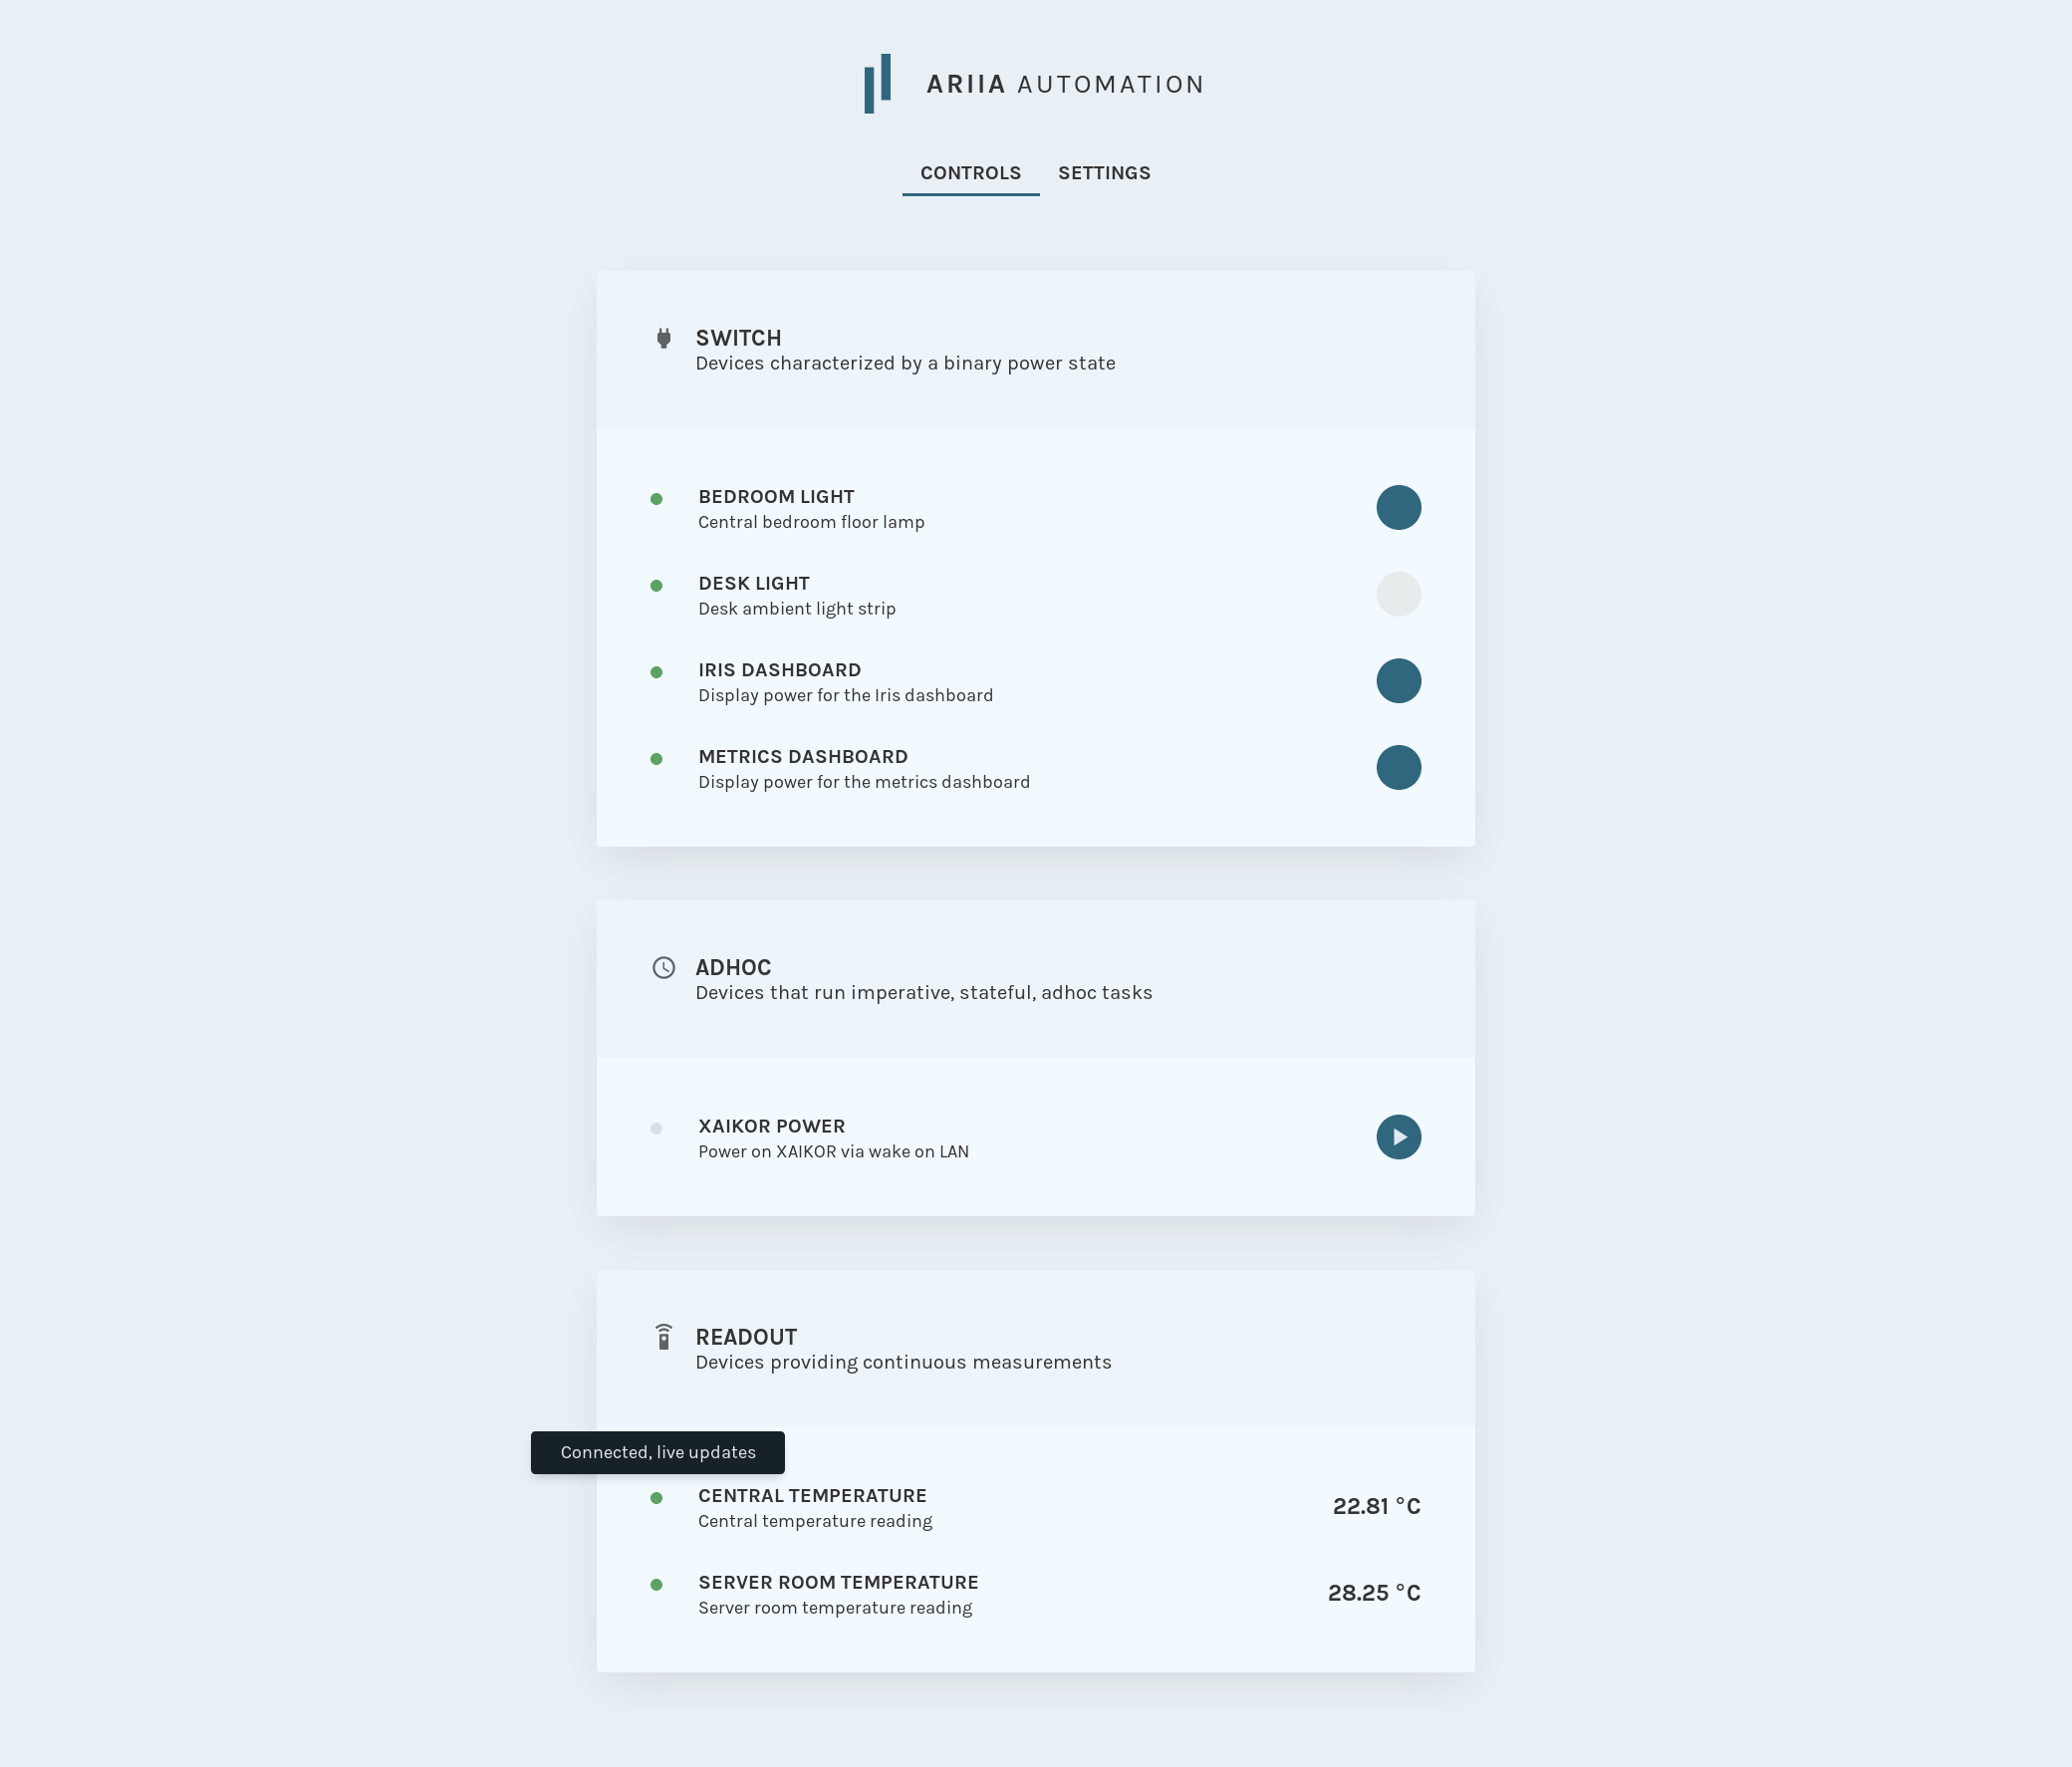
Zephyrus publishes a gRPC API for interacting with the connected device. This conveniently allows other clients to query the device for data (the statsd collector is merely one such client). For example, I use it to display live temperature information in my web dashboard for Ariia, my home automation framework:
Side note: Why gRPC? Rigid schemas built in with Protocol Buffers, abstractions for native server-side streaming, expressive while being language-agnostic, and more.
Deployment
The source code for Zephyrus is available on Github. (The Protobuf schemas are versioned independently in another repository.) To compile the application, you'll need Go 1.11 or later.
$ git clone git@github.com:LINKIWI/zephyrus.git
$ cd zephyrus/
$ make
# Output binaries are in bin/
The repository includes an example unit file for optionally daemonizing with systemd.