February 20, 2019 / 6:13 AM
Ingestion Pipeline for Advanced Pi-hole DNS Analytics
projects
devops
Pi-hole
Pi-holeis a self-hostable DNS server suitable for deployment in small networks. It uses a rules engine to block resolution of certain hostnames (by resolving to 127.0.0.1) but otherwise forwards queries to an upstream of your choosing (with a reasonably well-behaved cache layer in between). Pi-hole does not itself implement a DNS server (it's just a set of nice abstractions on top of dnsmasq), but it is decently configurable and very easy to install on a single node.
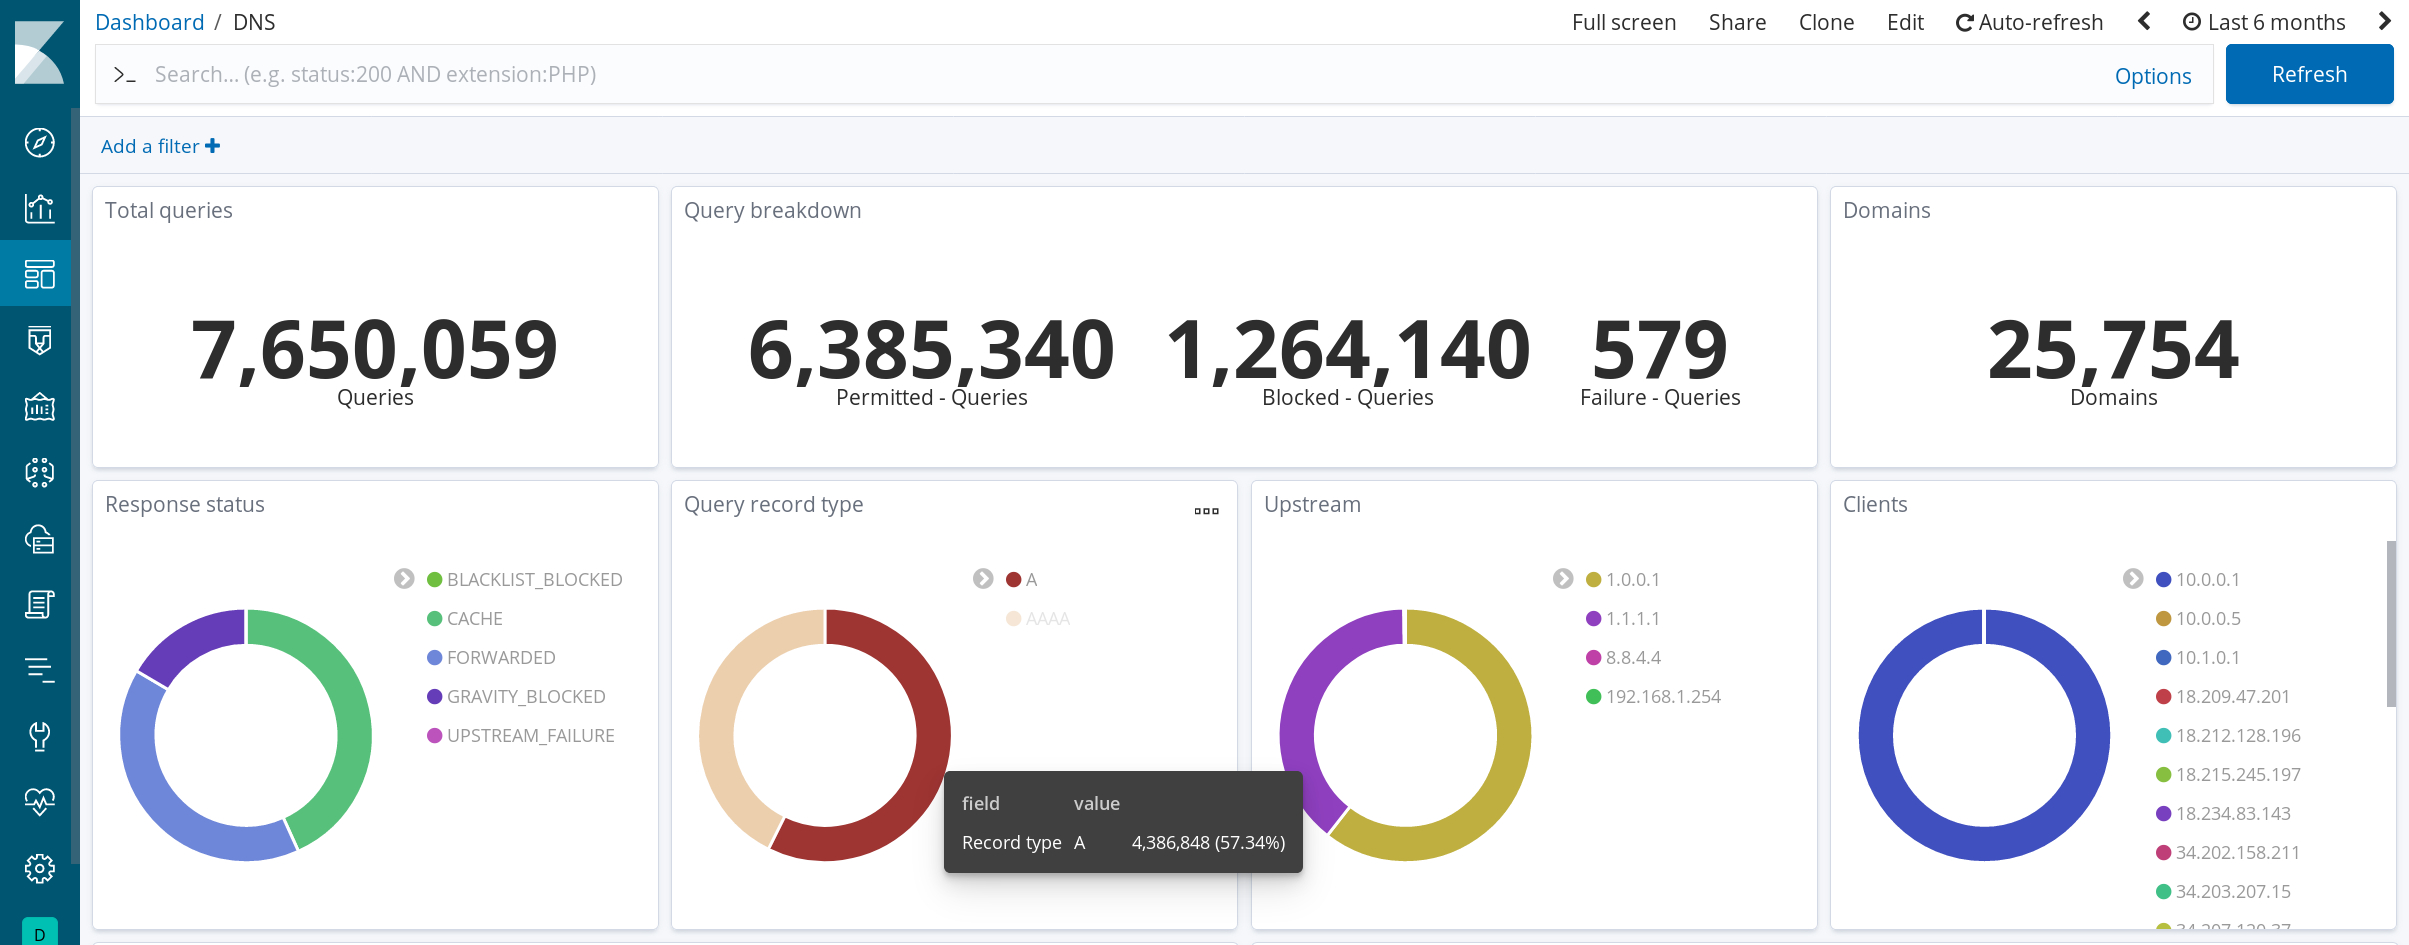
I deployed Pi-hole in my network some time ago, and it has since served over 7.6 million DNS queries across ~10 clients. With minimal effort, it has provided several wins:
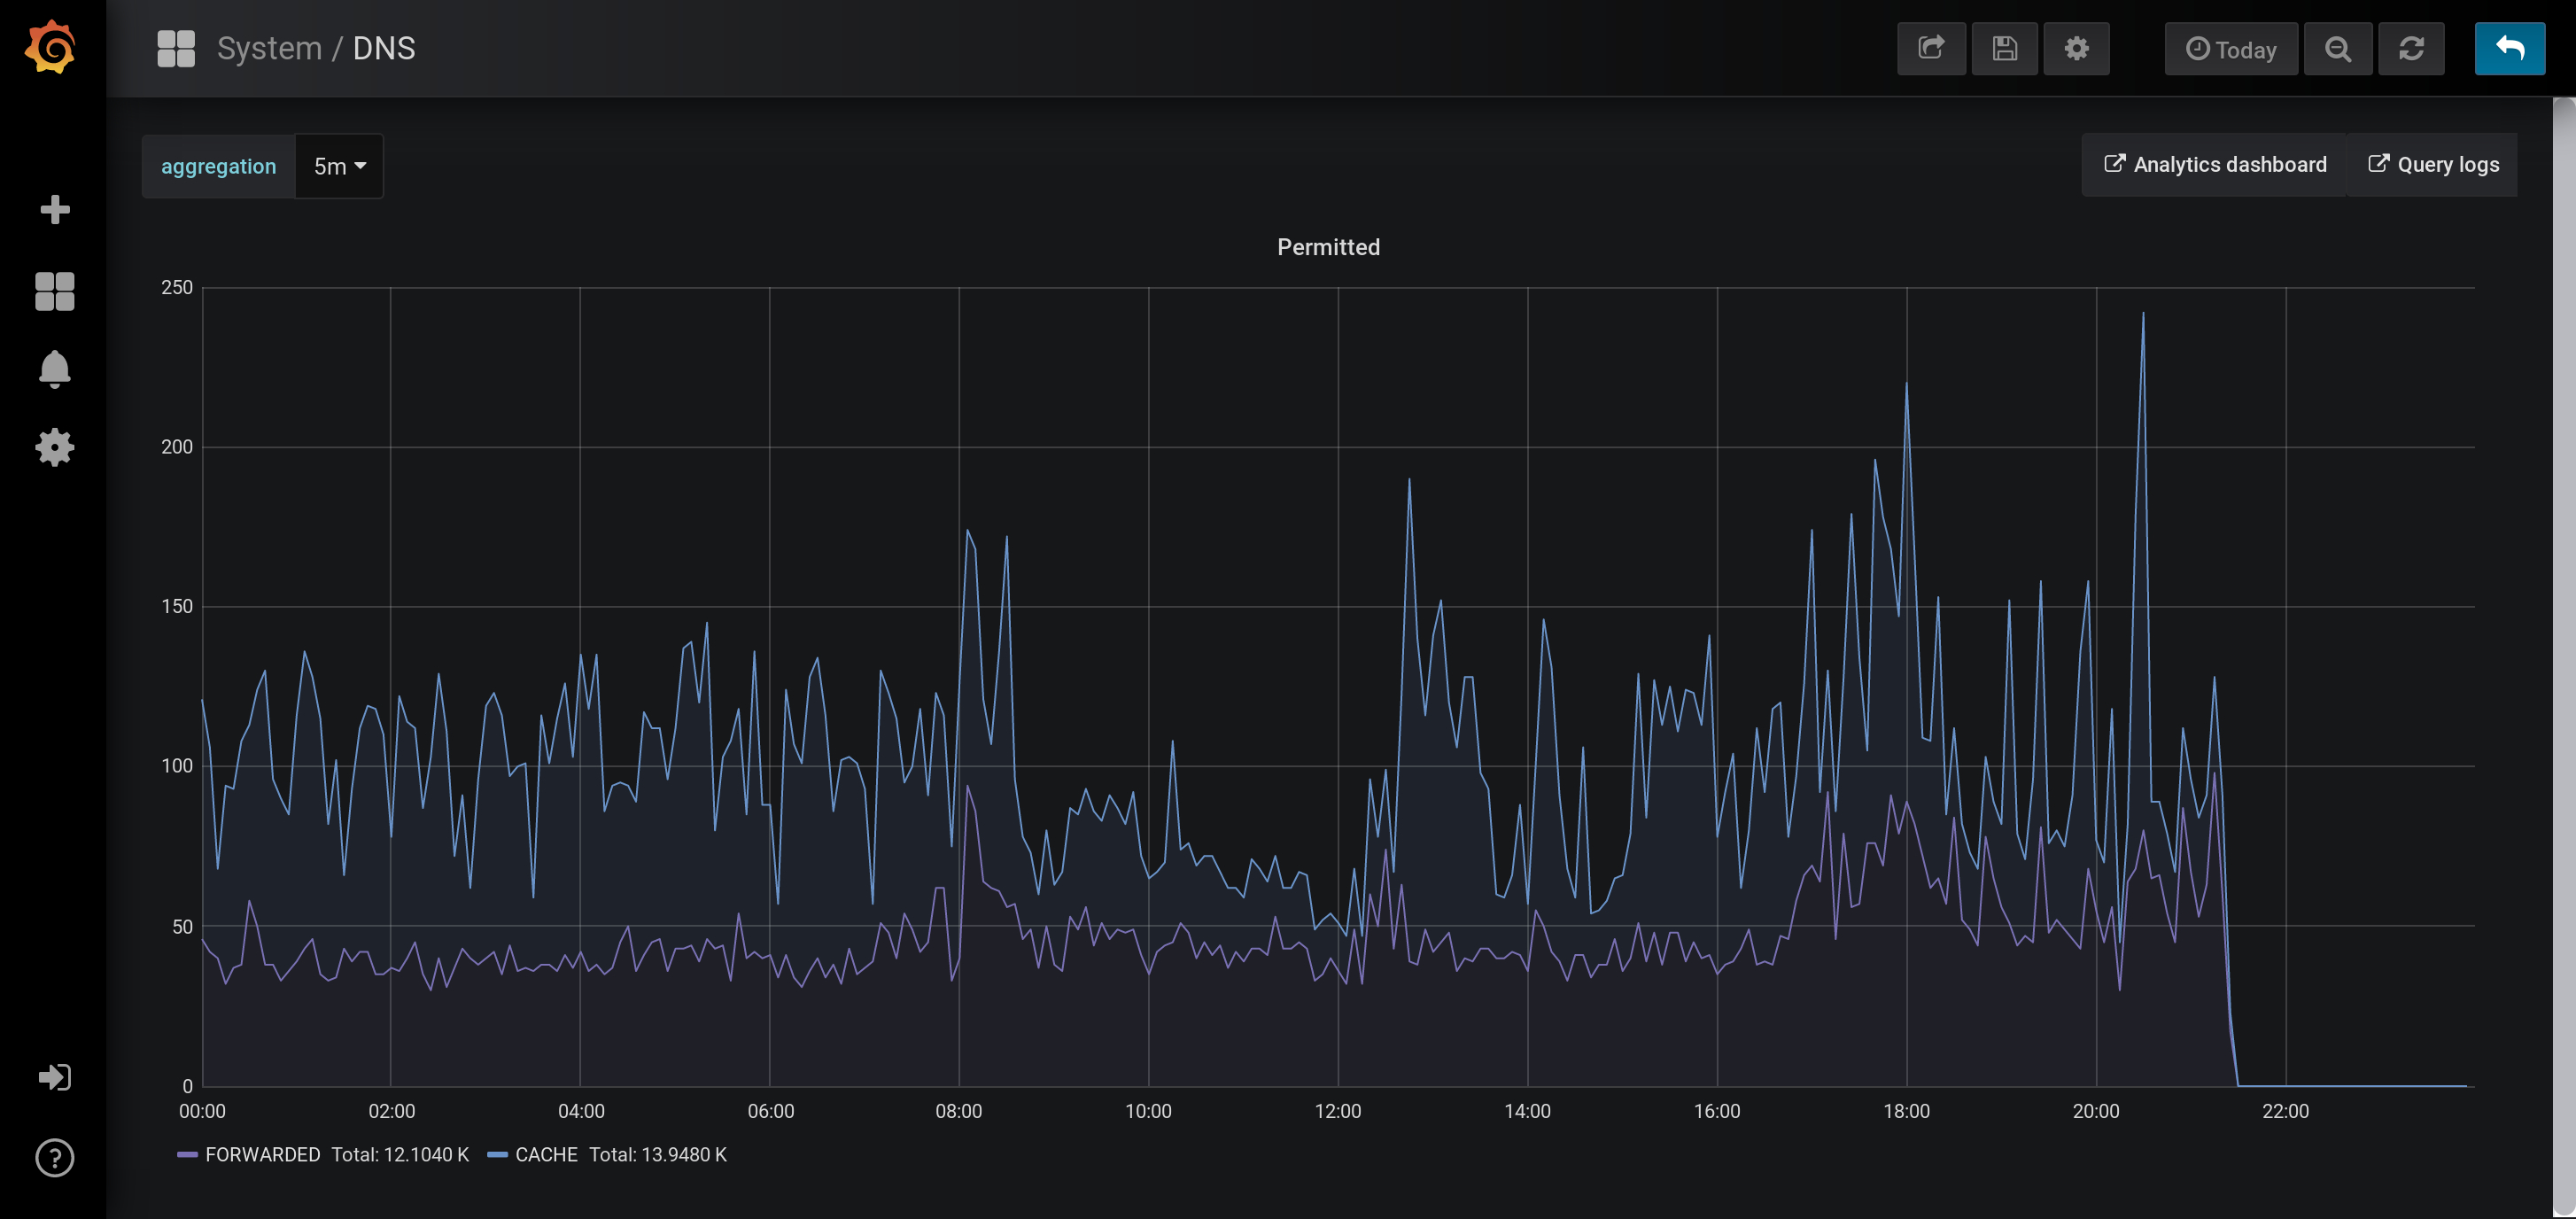
- Performance. Query patterns within my network result in about 30% of all DNS responses being served from the network-local cache. This significantly reduces resolution latency for popular domains by eliminating an additional forwarding hop outside of the network.
- Flexibility in blocking. A powerful rules engine for blacklisting domains has allowed very granular access control with zero client-side (device) configuration. Devices only need to be connected to my network; DHCP designates my router as the sole DNS server (which in itself uses the Pi-hole host as a single upstream). Clever clients who manually specify alternative DNS servers will have their ingress and egress traffic on port 53 routed to the Pi-hole host anyways with a router-level IP routing rule.
- Analytics. Pi-hole writes an audit log of all DNS queries, which acts as a rich source of data to provide detailed analytics into the behavior of all clients on the network.
The Problem with Pi-hole's Long Term Data
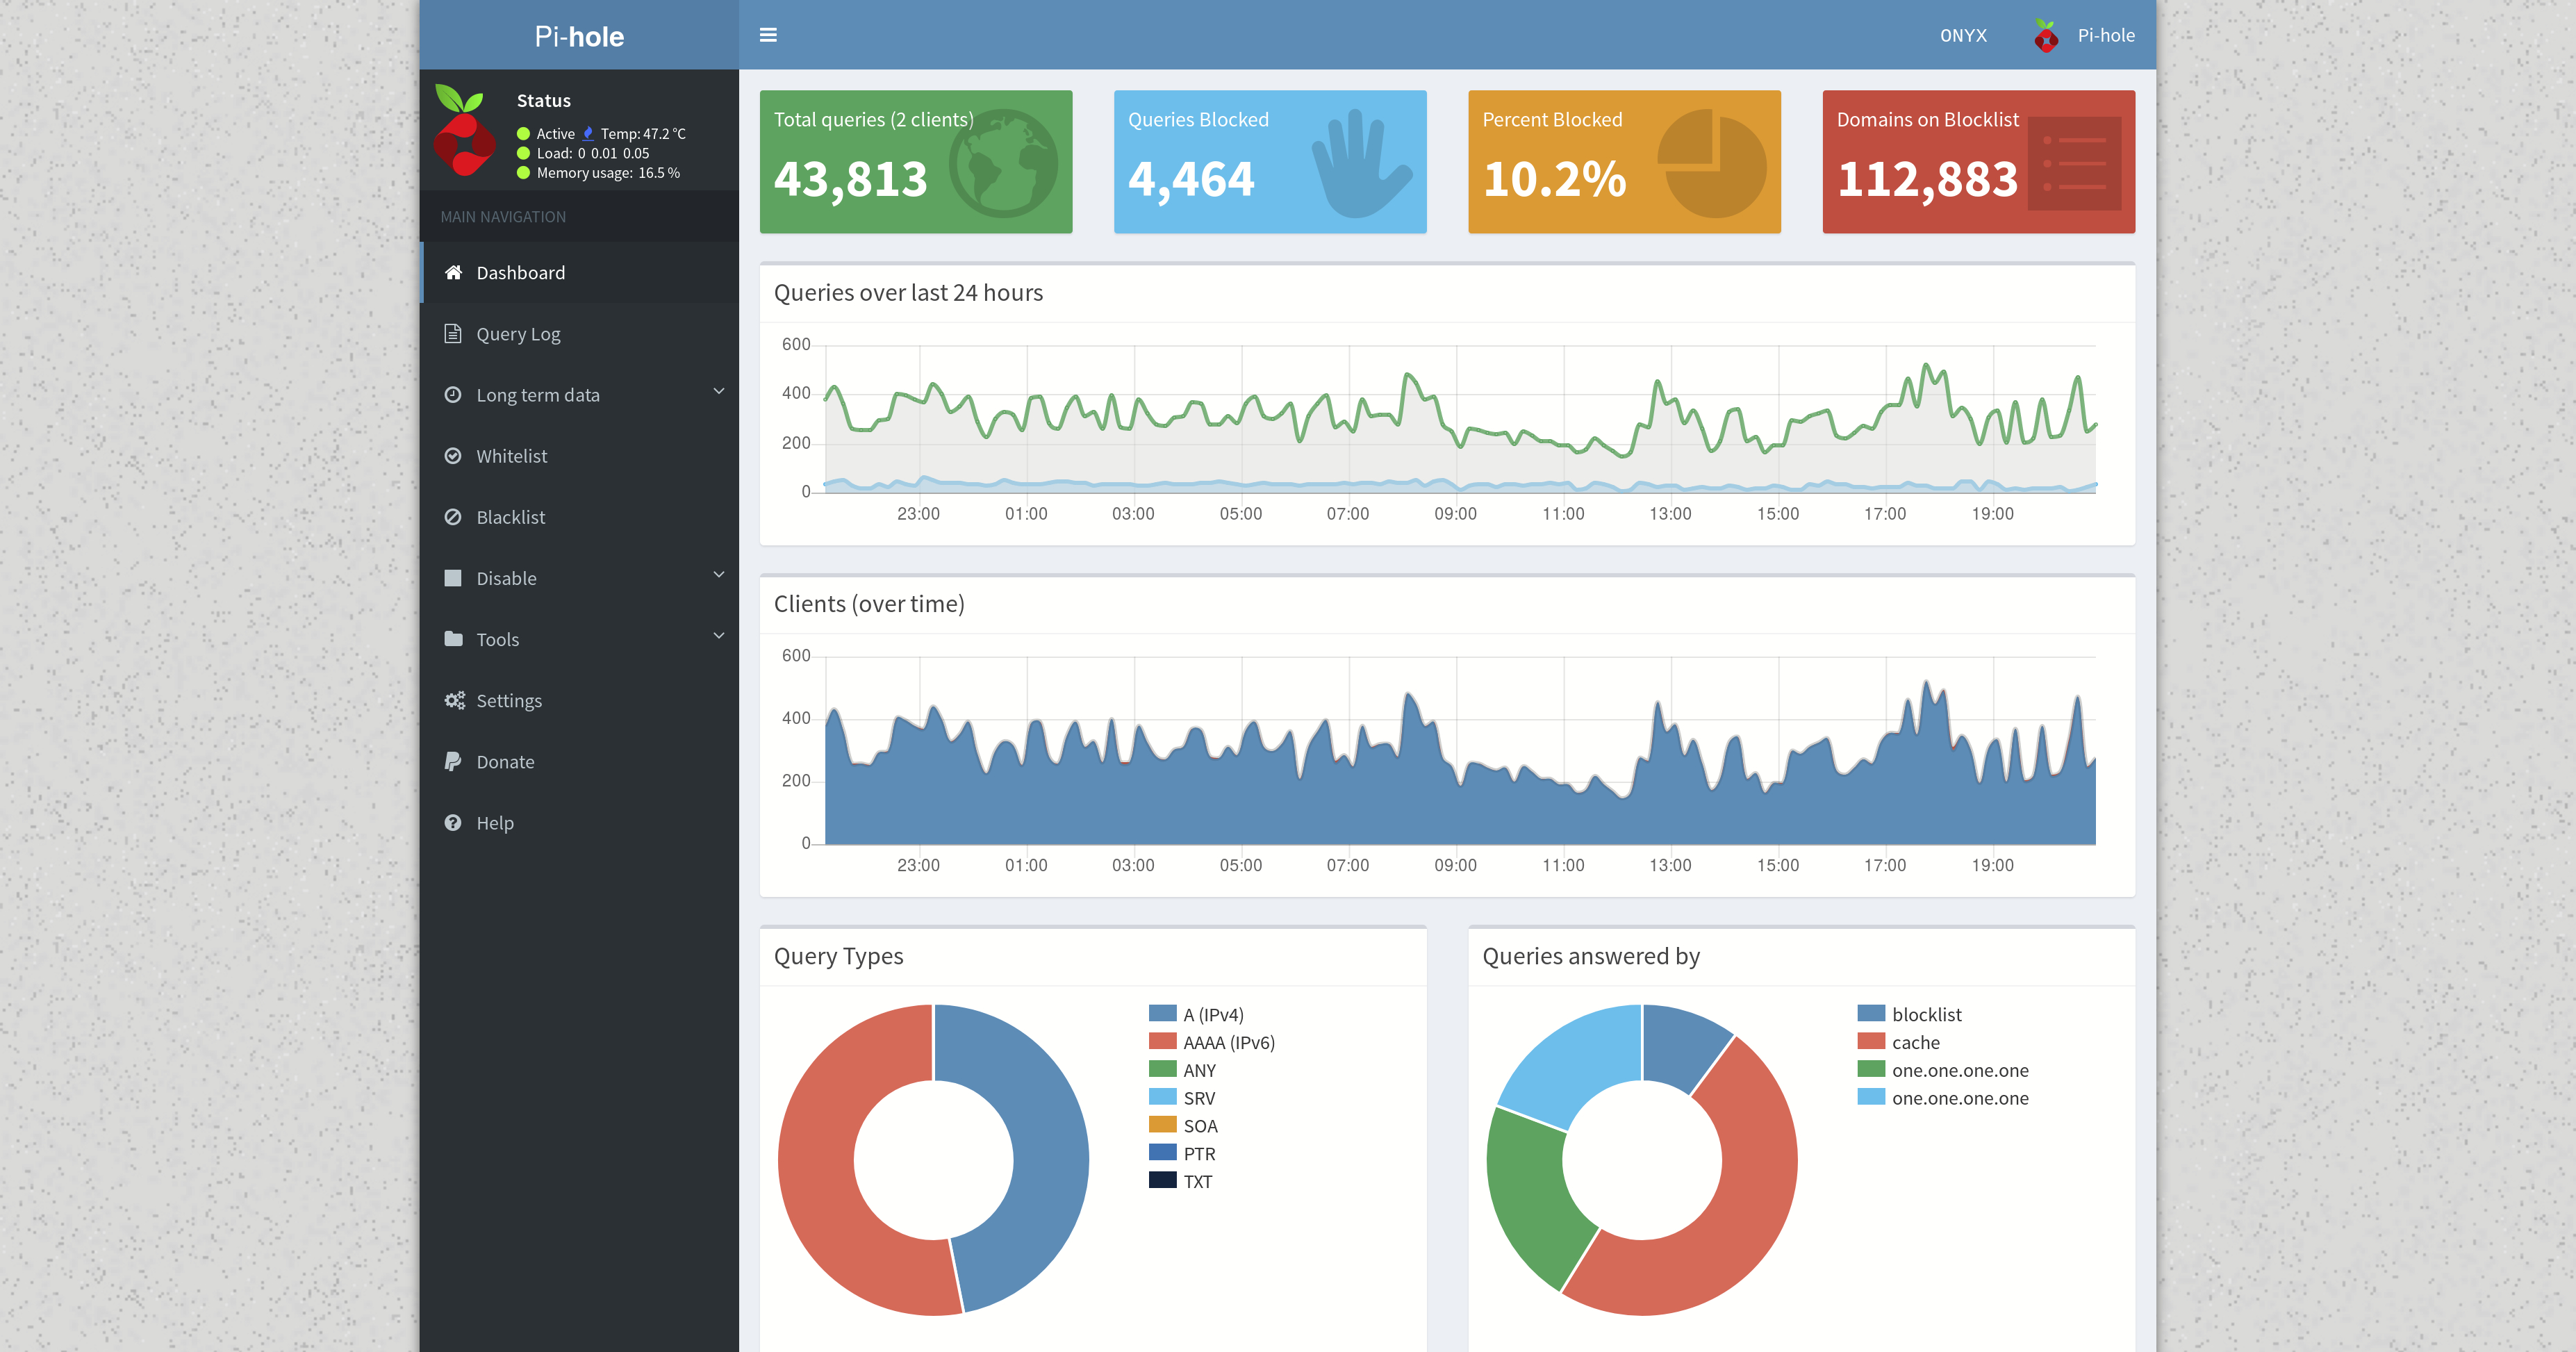
Pi-hole's long-term data analytics feature is not good.
- Audit logs are written to a SQLite database on disk. SQLite is both not a time-series datastore nor a search index, limiting Pi-hole's ability to efficiently perform aggregations across multiple dimensions. This is a fundamental requirement of almost all analytics workflows.
- The FTL implementation is so tightly coupled to SQLiteas a storage backend that supporting a more appropriate datastore would require significant modifications to the existing codebase. It's difficult to keep a fork in sync with the upstream when such a large chunk of the project is replaced.
- With tens of thousands of DNS queries answered per day, querying the SQLite long-term database is a very memory-intensive task. When running on commodity hardware, such queries will exhaust PHP and/or system memory, effectively preventing analytics on date ranges longer than a few days.
- Use of SQLite offers no flexibility to offload analytics computations to another host (without using a network-mounted filesystem or something equally inelegant).
- The web UI presents data aggregated along only a few interesting dimensions and offers visualizations with limited functionality and interactivity.
An Ingestion Pipeline for Advanced Analytics
There are existing open source databases suitable for time-series metrics and log indexing. All I needed was a mechanism to write all of Pi-hole's analytics data to these databases, instead of (or in addition to) local SQLite. My initial survey of possible solutions that didn't require modifying the Pi-hole codebase itself was mostly unsuccessful:
- The C sqlite3_update_hookAPI does not work across process boundaries, preventing the use case where a sidecar acts on SQLite data changes performed by another process in real-time
- The SQLite WAL format is OS-dependent and incredibly complex, thereby making an inotify-based WAL watcher difficult to debug and maintain
I opted for a simpler (though not real-time) solution: I'm open sourcing repliqate, the result of this effort. Repliqate is a general-purpose service that replicates SQL rows for append-only write patterns to a Kafkaqueue, whose consumers can ingest the data to a datastore of their choice. Repliqate is designed to be maximally data-agnostic (but supports the Pi-hole workflow as the ideal case), fault-tolerant, and appropriate for use in a distributed system with multiple concurrent data consumers and producers.
Currently, repliqate's Kafka topic has two consumers: Telegraf, for ingestion into InfluxDB(time-series analysis) and Logstash, for ingestion into Elasticsearch(indexing and searching). I use Grafanaand Kibanaas visualization frontends, respectively.
This has afforded the opportunity to efficiently explore long-term DNS query patterns with greater depth than that offered natively by Pi-hole. For example:
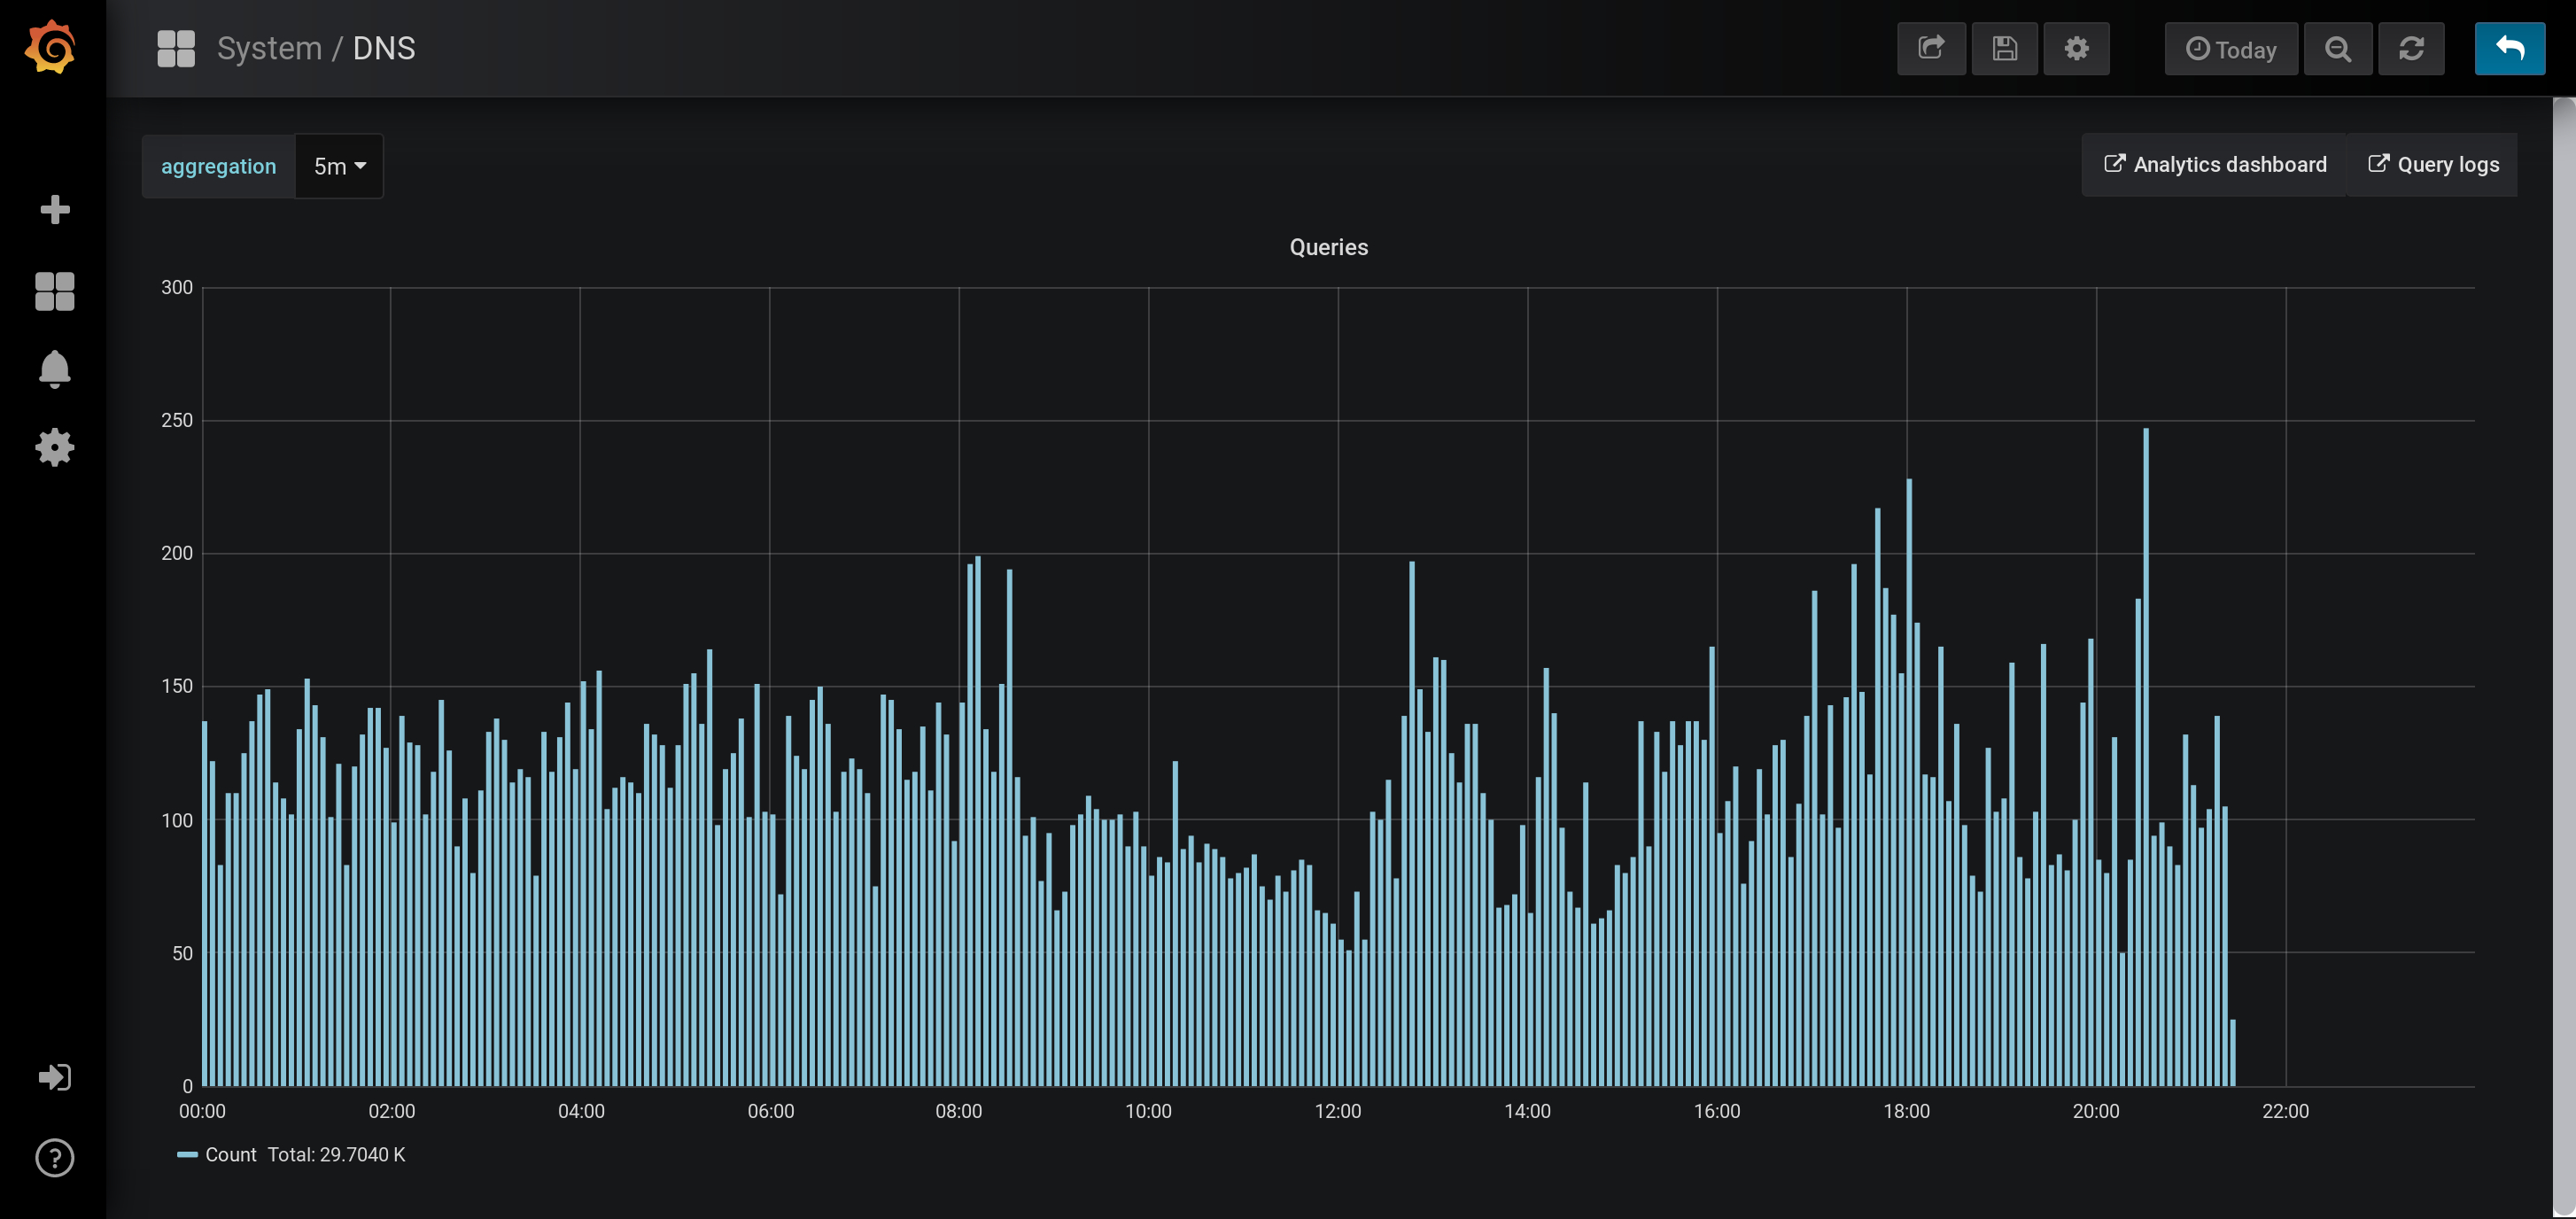
Historical query volume: DNS requests served at various hours of the day
Historical cache hit rate: Frequency of requests served out of Pi-hole's local cache
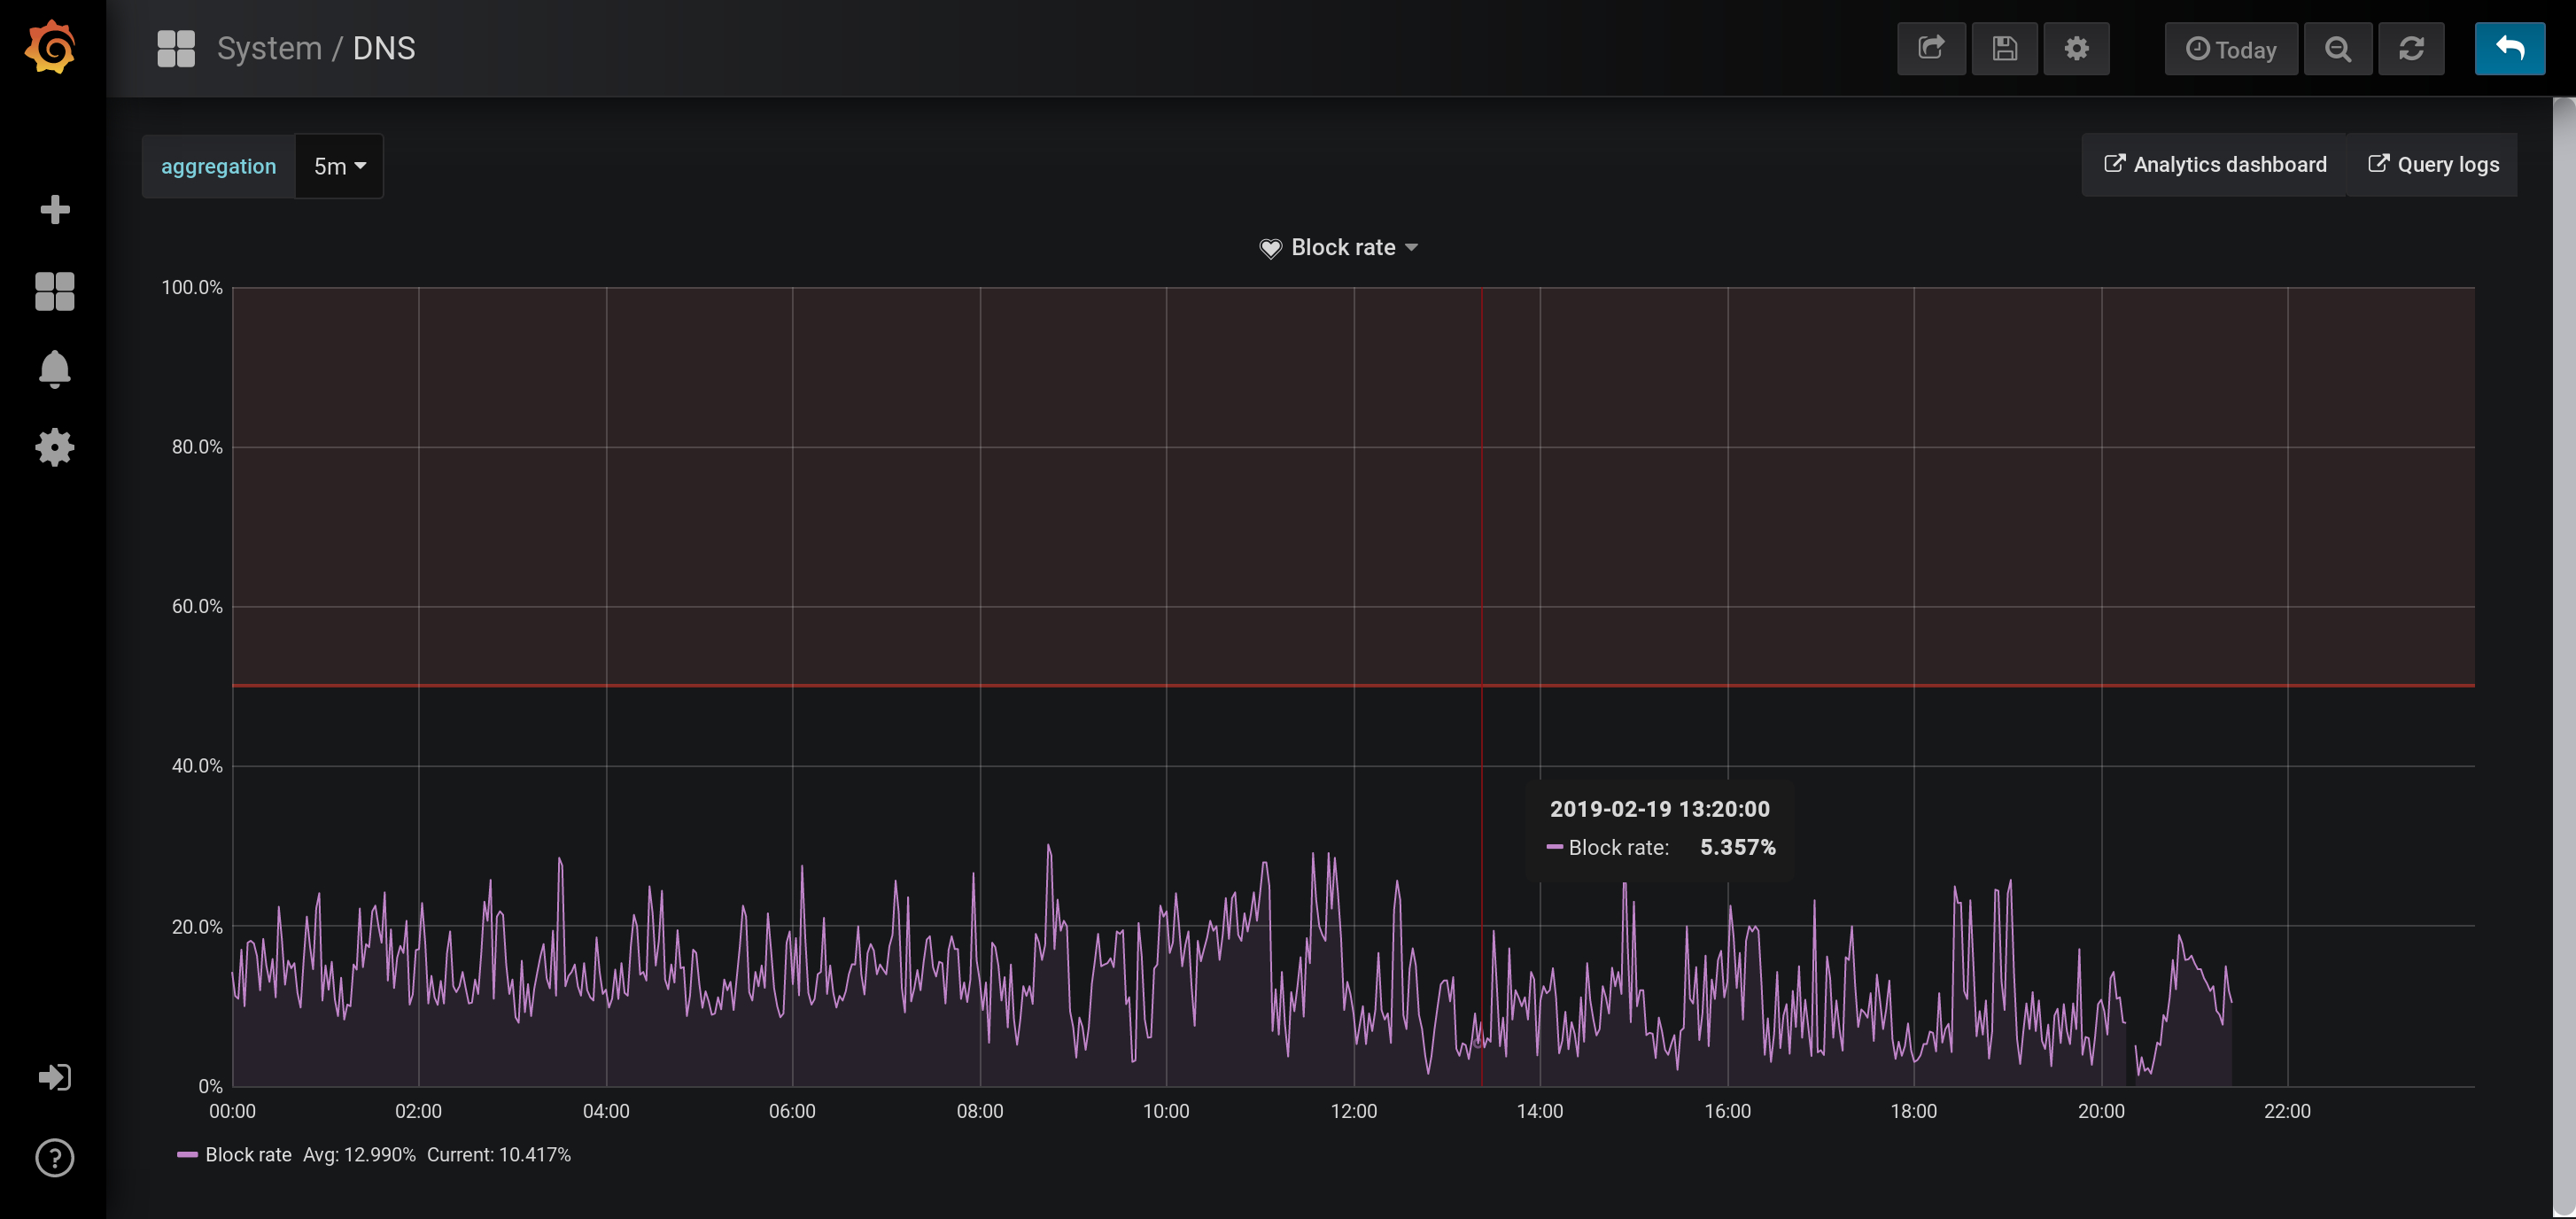
Alerting on anomalies in block rate: Automated monitoring for rogue clients when a threshold number of their requests are blocked in a fixed time interval
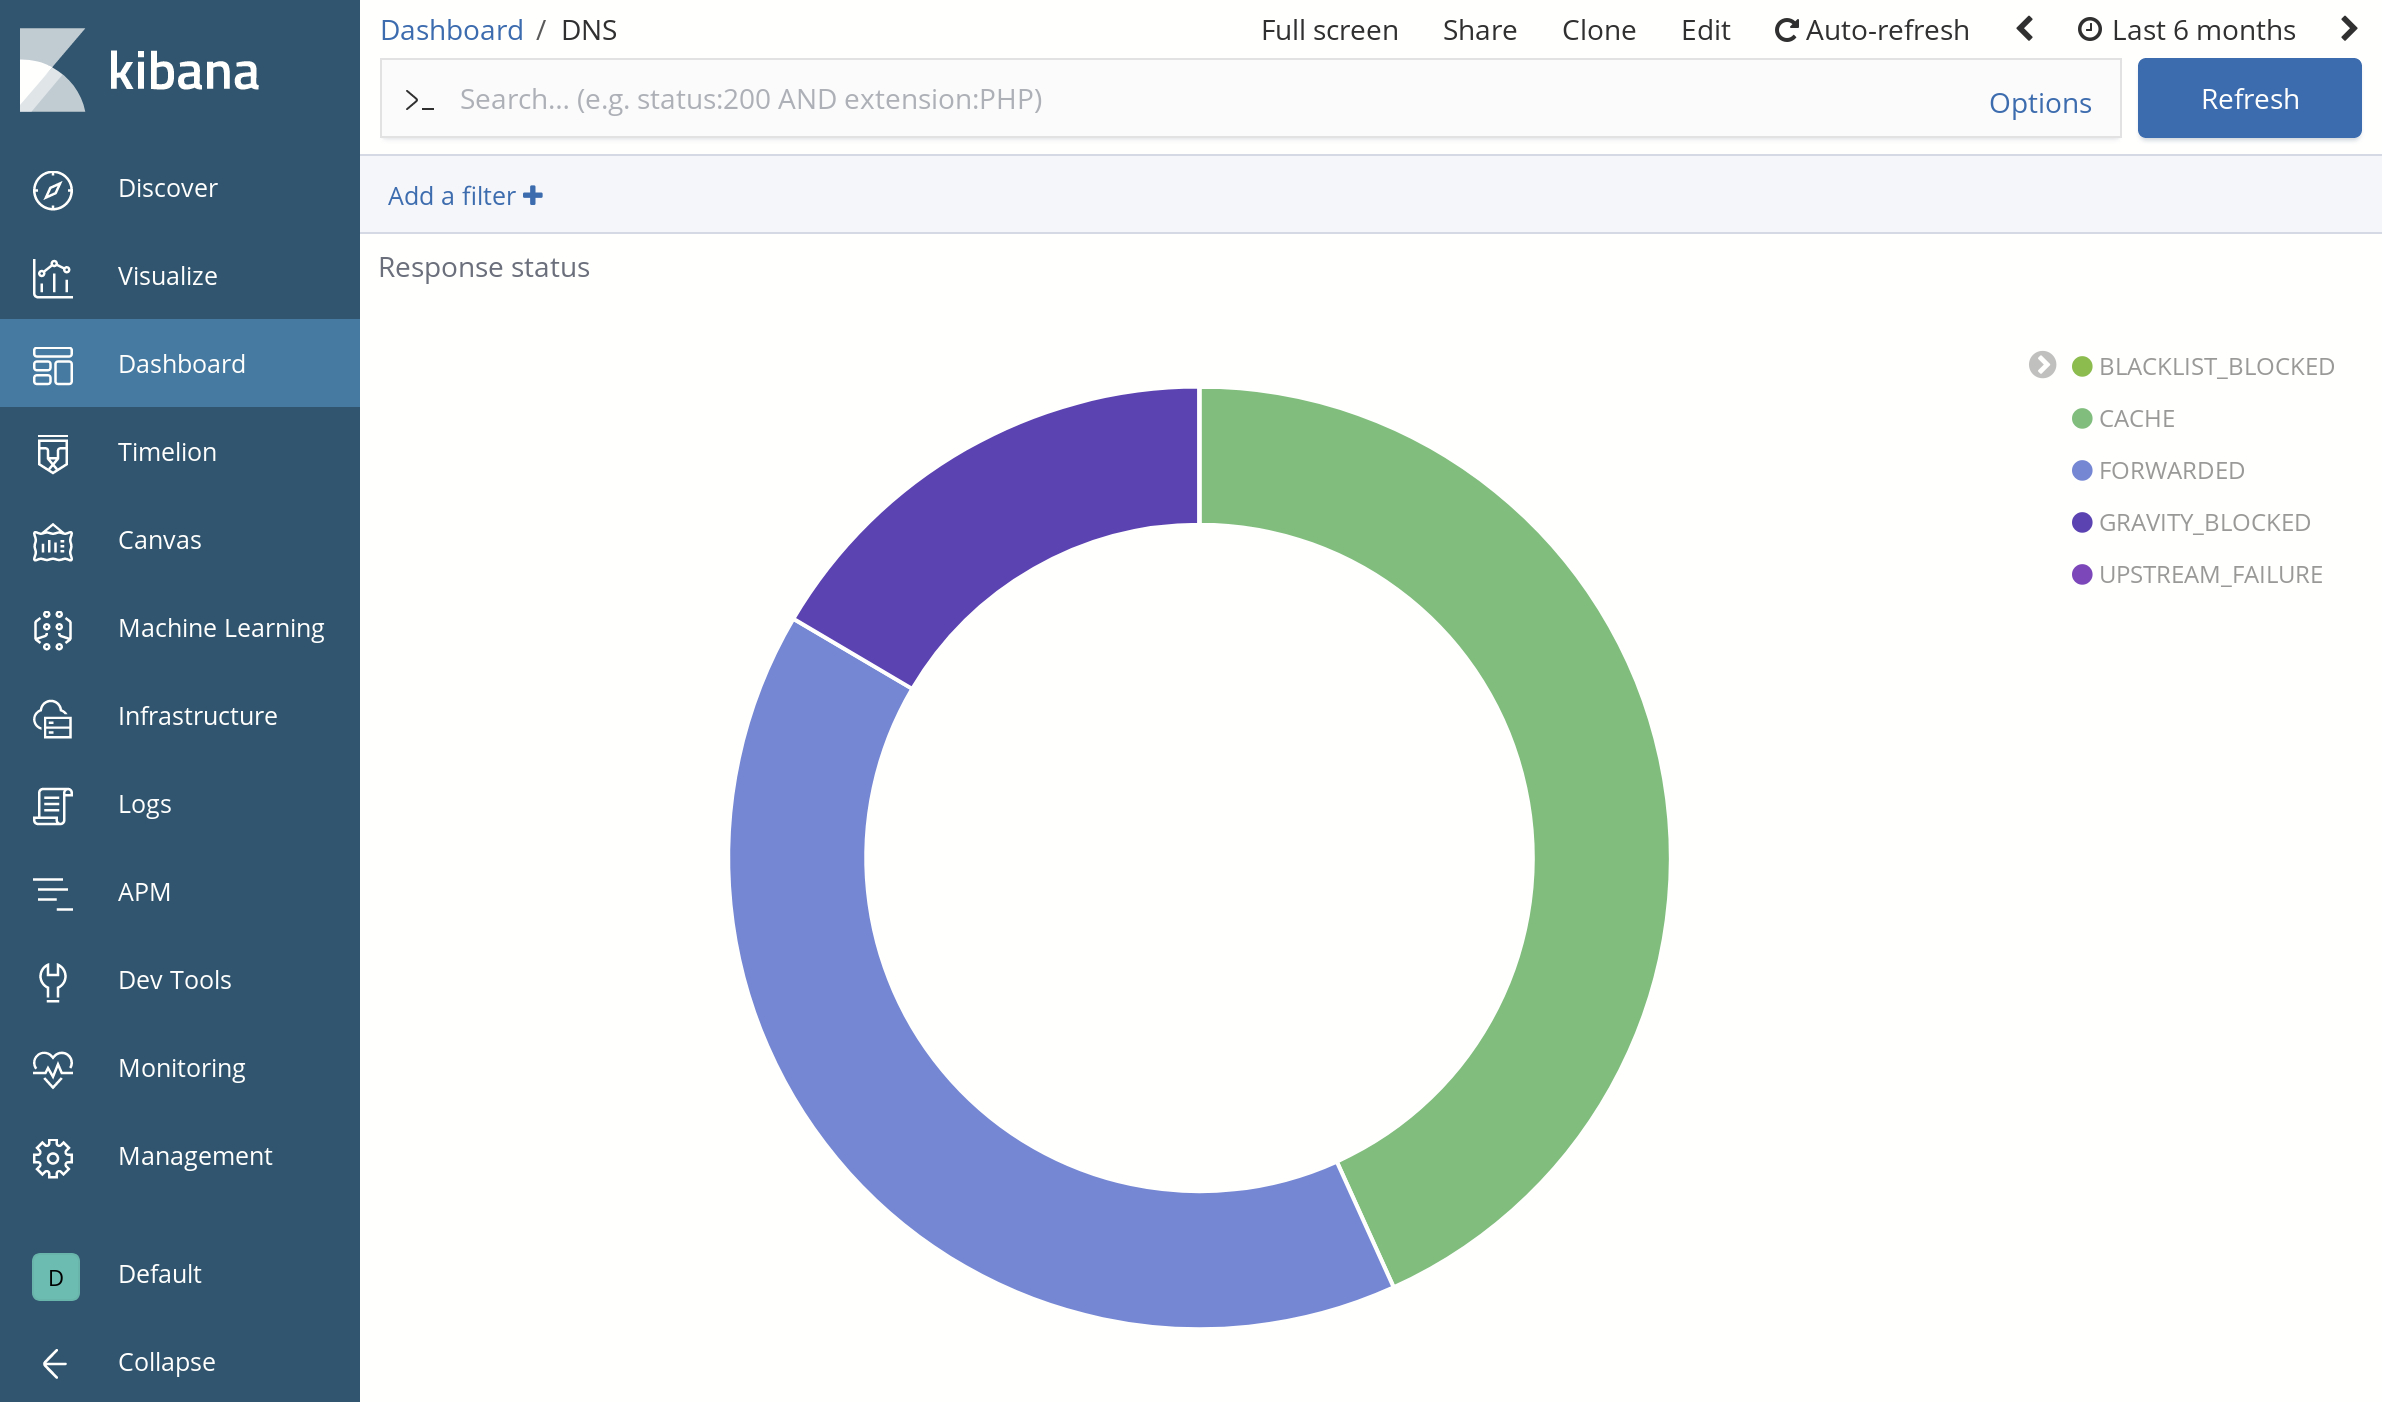
Aggregating by response status: Visibility into the types of DNS responses returned to clients
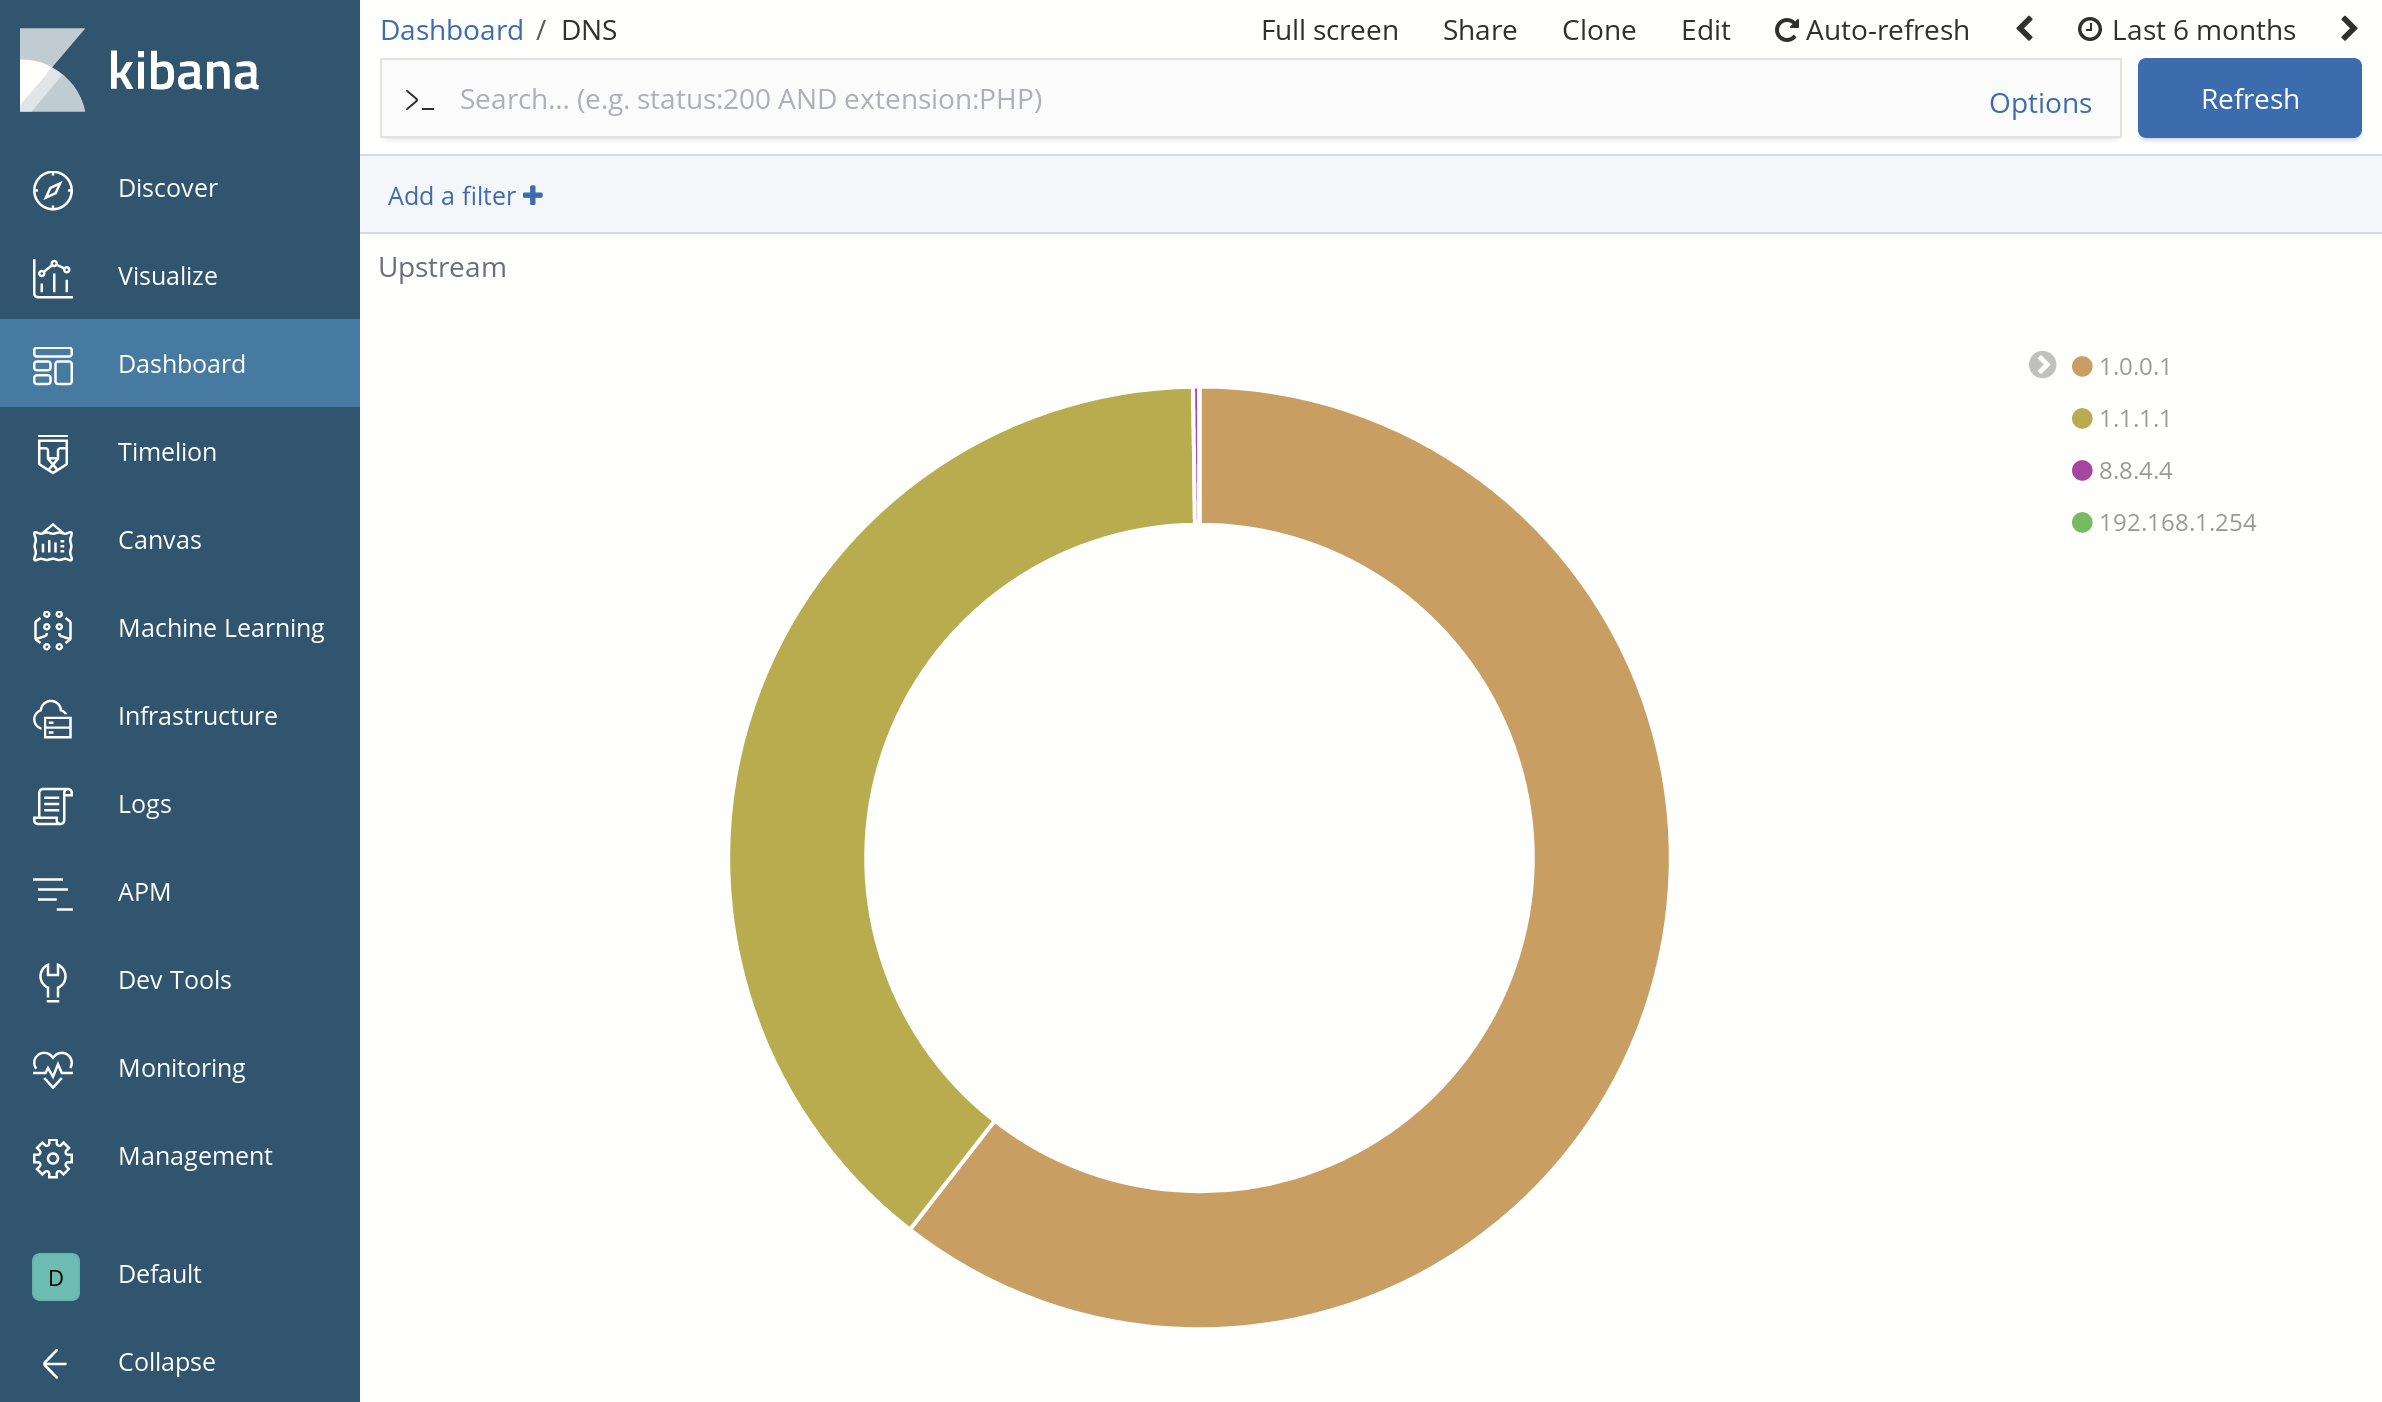
Load balancing among upstreams: Query volume to all DNS servers configured as forwarding upstreams
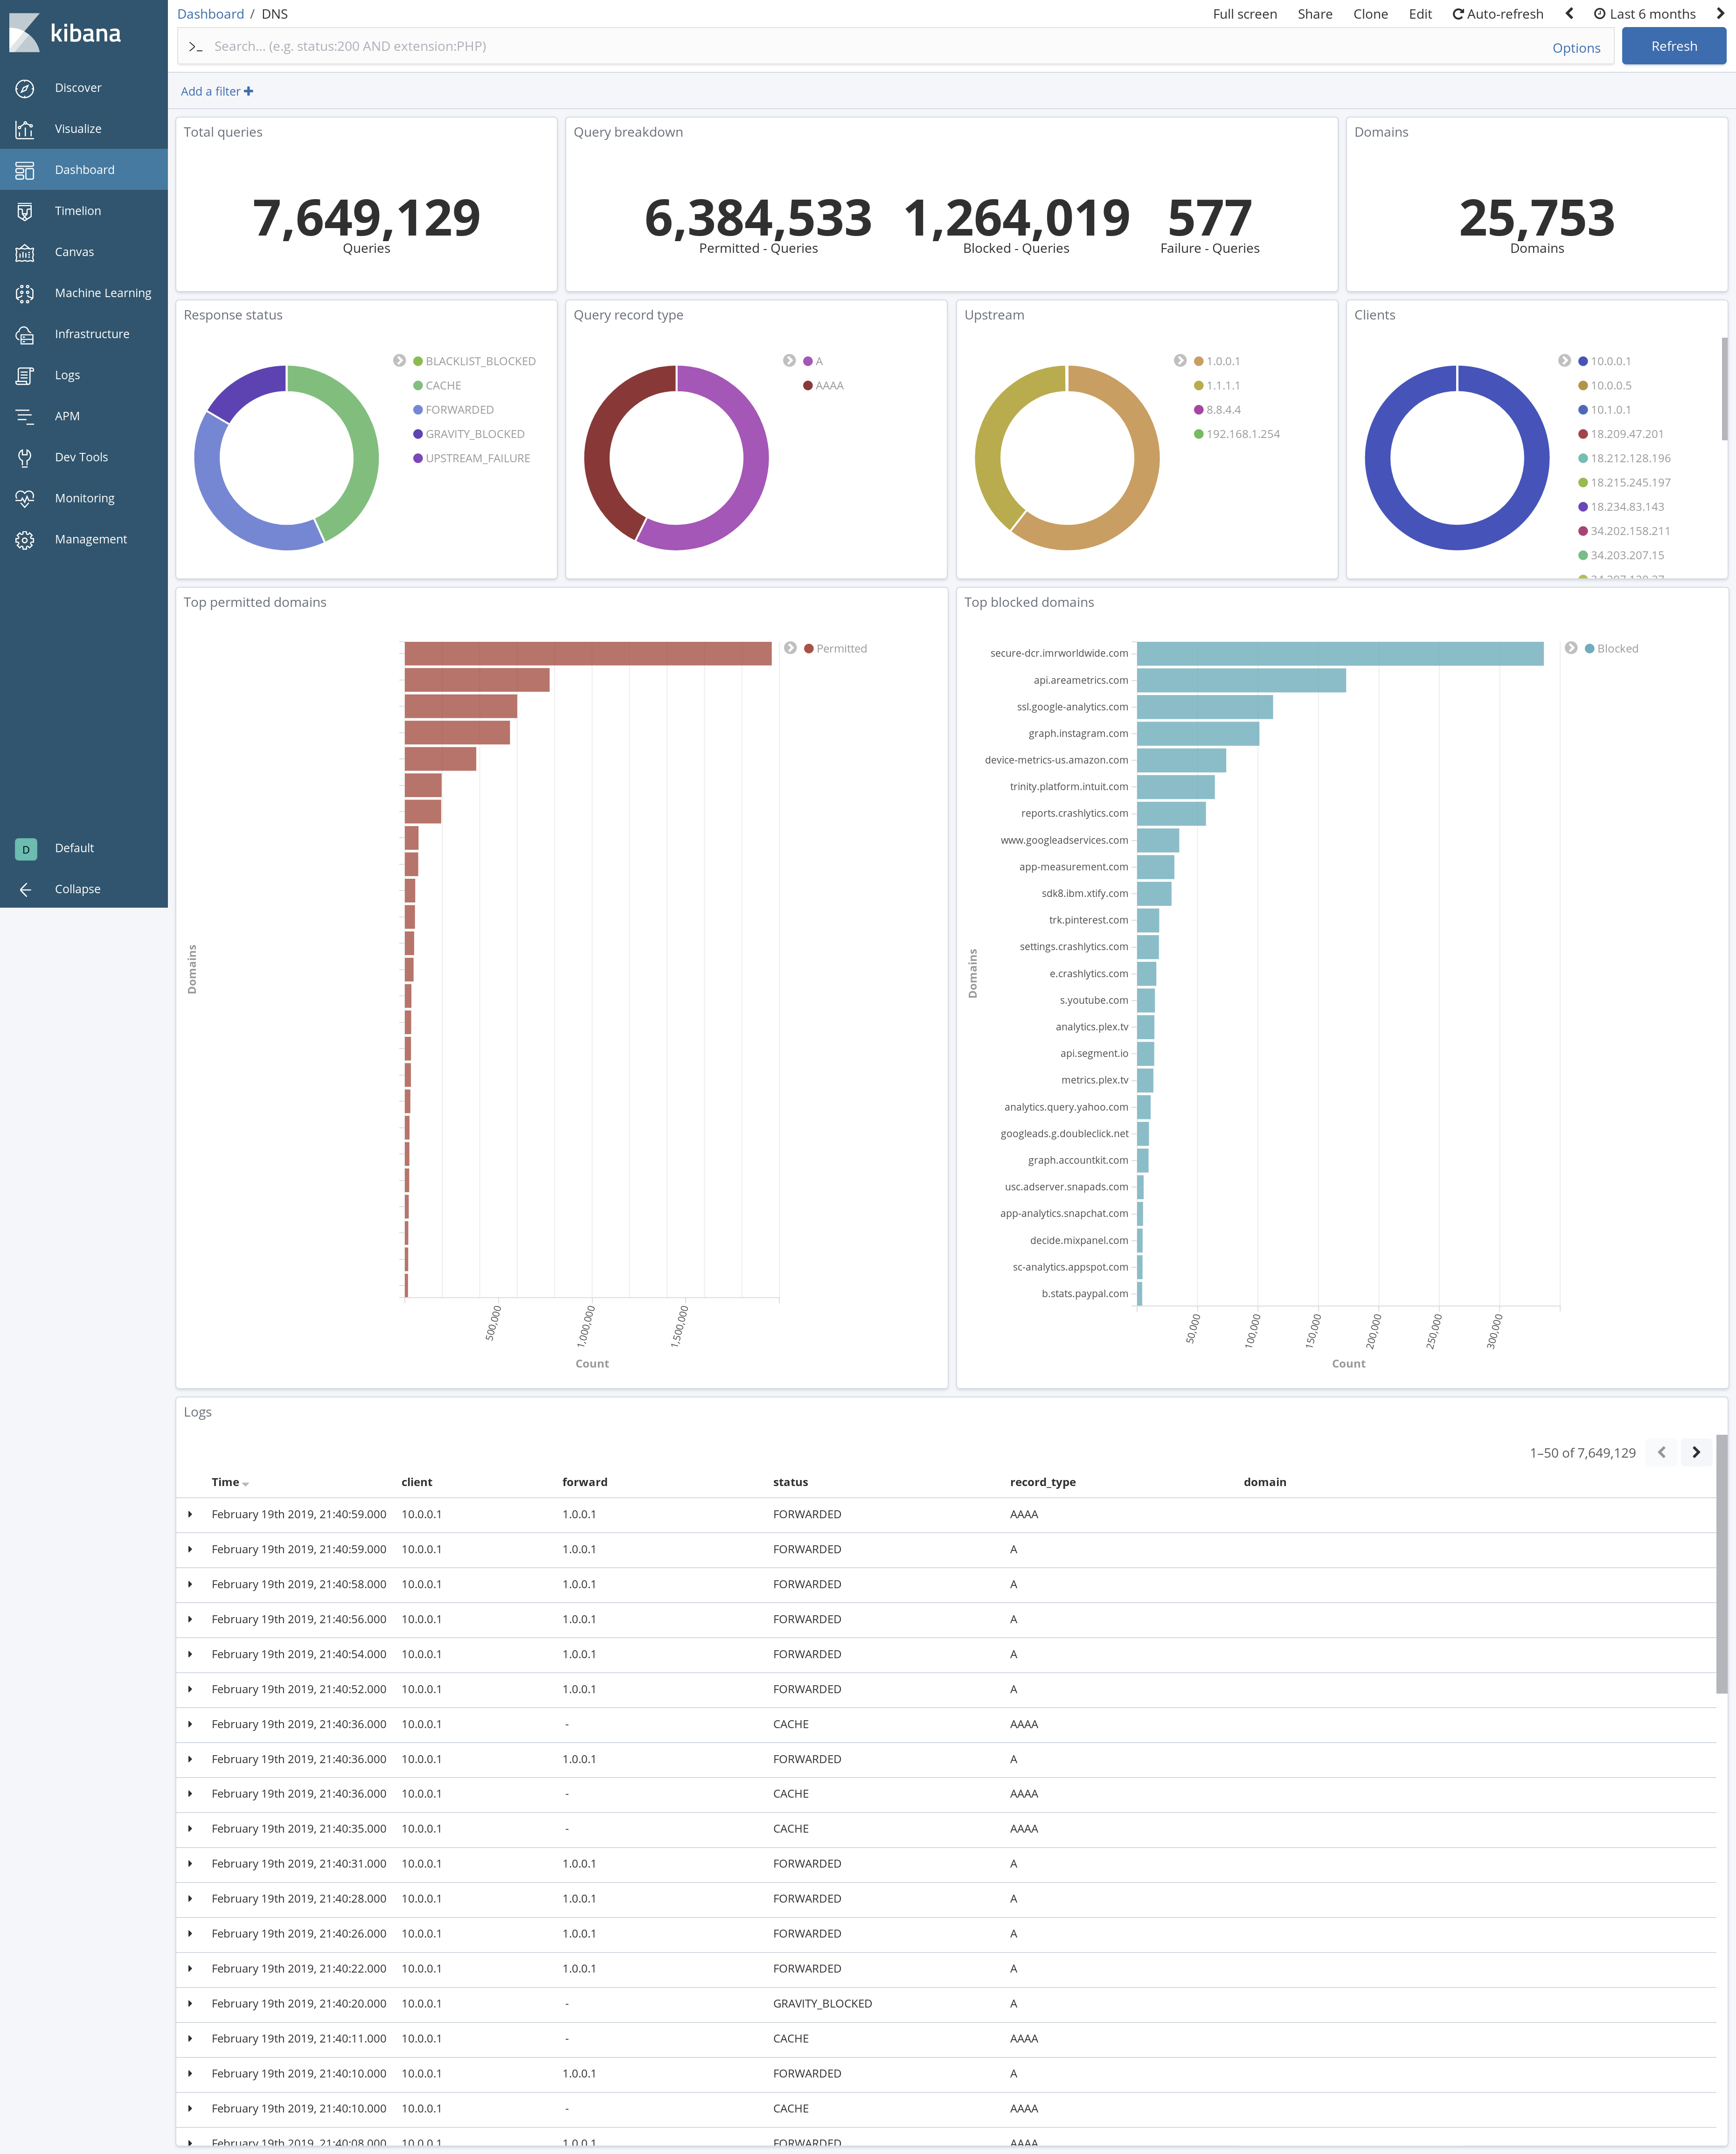
These analytics are summarized in some nice dashboards (some details below are deliberately obfuscated):
This was a fun project and provided some interesting insights into how devices on my network talk to the outside world. You can learn more about Pi-hole on its websiteor check out repliqate on Github.
Appendix
If you're interested in setting up a repliqate instance for your own Pi-hole server, this config works well for my use case:
repliqate:
  name: dns
  statsd_addr: localhost:8125
  redis_addr: localhost:6379
  replication:
    poll_interval_sec: 300
    sql_source:
      uri: sqlite:////etc/pihole/pihole-FTL.db
      table: queries
      primary_key: id
      fields:
        - id
        - timestamp
        - type
        - status
        - domain
        - client
        - forward
      limit: 500
    kafka_target:
      topic: repliqate-dns
      brokers:
        - 127.0.0.1:9092
The Telegraf config I use for InfluxDB ingestion:
[[inputs.kafka_consumer]]
    brokers = ["localhost:9092"]
    topics = ["repliqate-dns"]
    consumer_group = "telegraf"
    offset = "oldest"

    data_format = "json"
    json_query = "data"
    name_override = "dns_query"
    tag_keys = ["client", "forward", "type", "status"]
    json_time_key = "timestamp"
    json_time_format = "unix"
And the Logstash config I use for Elasticsearch ingestion:
input {
    kafka {
        bootstrap_servers => "localhost:9092"
        topics => "repliqate-dns"
        group_id => "logstash"
        type => "dns"
    }
}

filter {
    if [type] == "dns" {
        json {
            source => "message"
        }
        date {
            match => ["[data][timestamp]", "UNIX"]
        }
        translate {
            field => "[data][type]"
            destination => "[record_type]"
            dictionary => {
                "1" => "A"
                "2" => "AAAA"
                "3" => "ANY"
                "4" => "SRV"
                "5" => "SOA"
                "6" => "PTR"
                "7" => "TXT"
            }
            fallback => "UNKNOWN"
        }
        translate {
            field => "[data][status]"
            destination => "[status]"
            dictionary => {
                "0" => "UPSTREAM_FAILURE"
                "1" => "GRAVITY_BLOCKED"
                "2" => "FORWARDED"
                "3" => "CACHE"
                "4" => "WILDCARD_BLOCKED"
                "5" => "BLACKLIST_BLOCKED"
            }
            fallback => "UNKNOWN"
        }
        mutate {
            rename => {
                "[data][id]" => "[id]"
                "[data][domain]" => "[domain]"
                "[data][client]" => "[client]"
                "[data][forward]" => "[forward]"
            }
        }
        mutate {
            remove_field => ["message", "timestamp", "name", "table", "data", "hash"]
        }
    }
}

output {
    if [type] == "dns" {
        elasticsearch {
            hosts => ["localhost:9200"]
            index => "dns-%{+YYYY.MM}"
            document_type => "dns"
            document_id => "%{[id]}"
            # The template here just defines "client" and "forward" to be IP fields.
            # It's not strictly necessary.
            manage_template => true
            template => "/etc/logstash/templates.d/dns.json"
            template_name => "dns"
            template_overwrite => true
        }
    }
}
(You can always write your own Kafka consumer to execute arbitrary logic.)
